Lecture 4: Analysis and Validation
Today’s Visualization
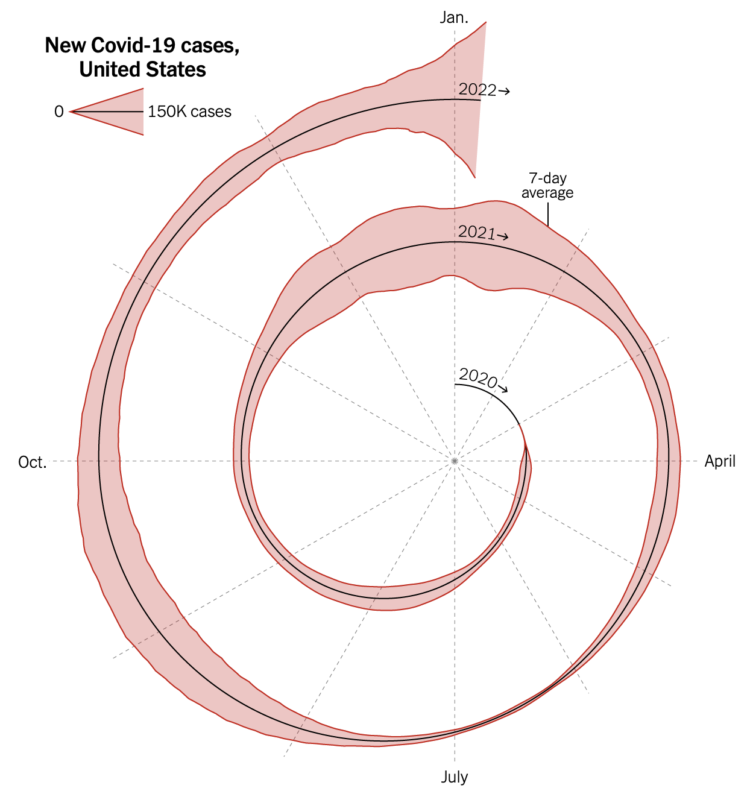
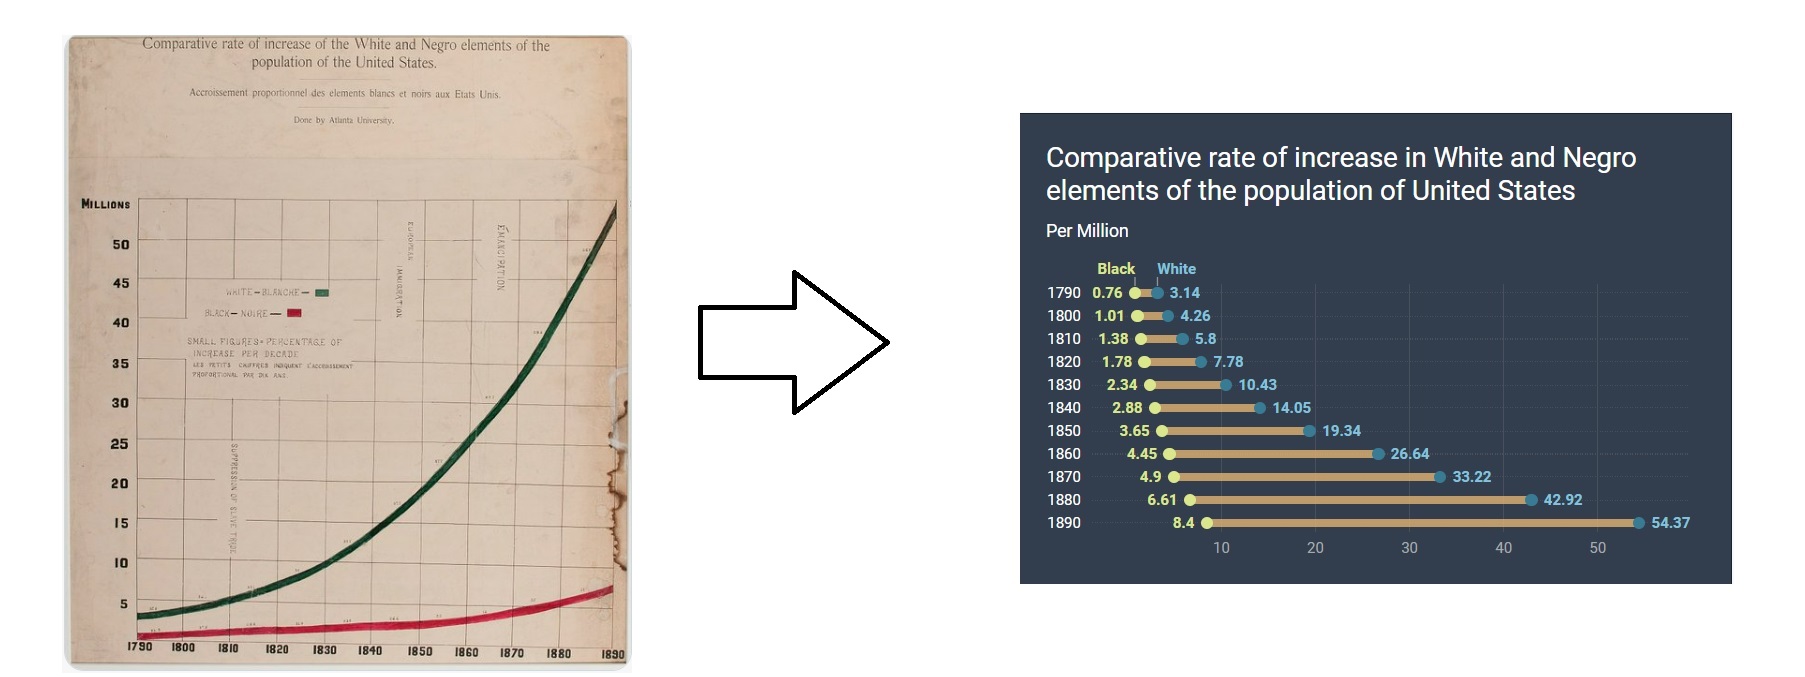
This graph garnered a lot of opinions about a year ago, setting data vis twitter and blogosphere ablaze. As an attention getter, it certainly was very effective.
In R, there is the spiralize package that makes making this kind of a visualization very easy. Other platforms may have to work harder to make something like it.
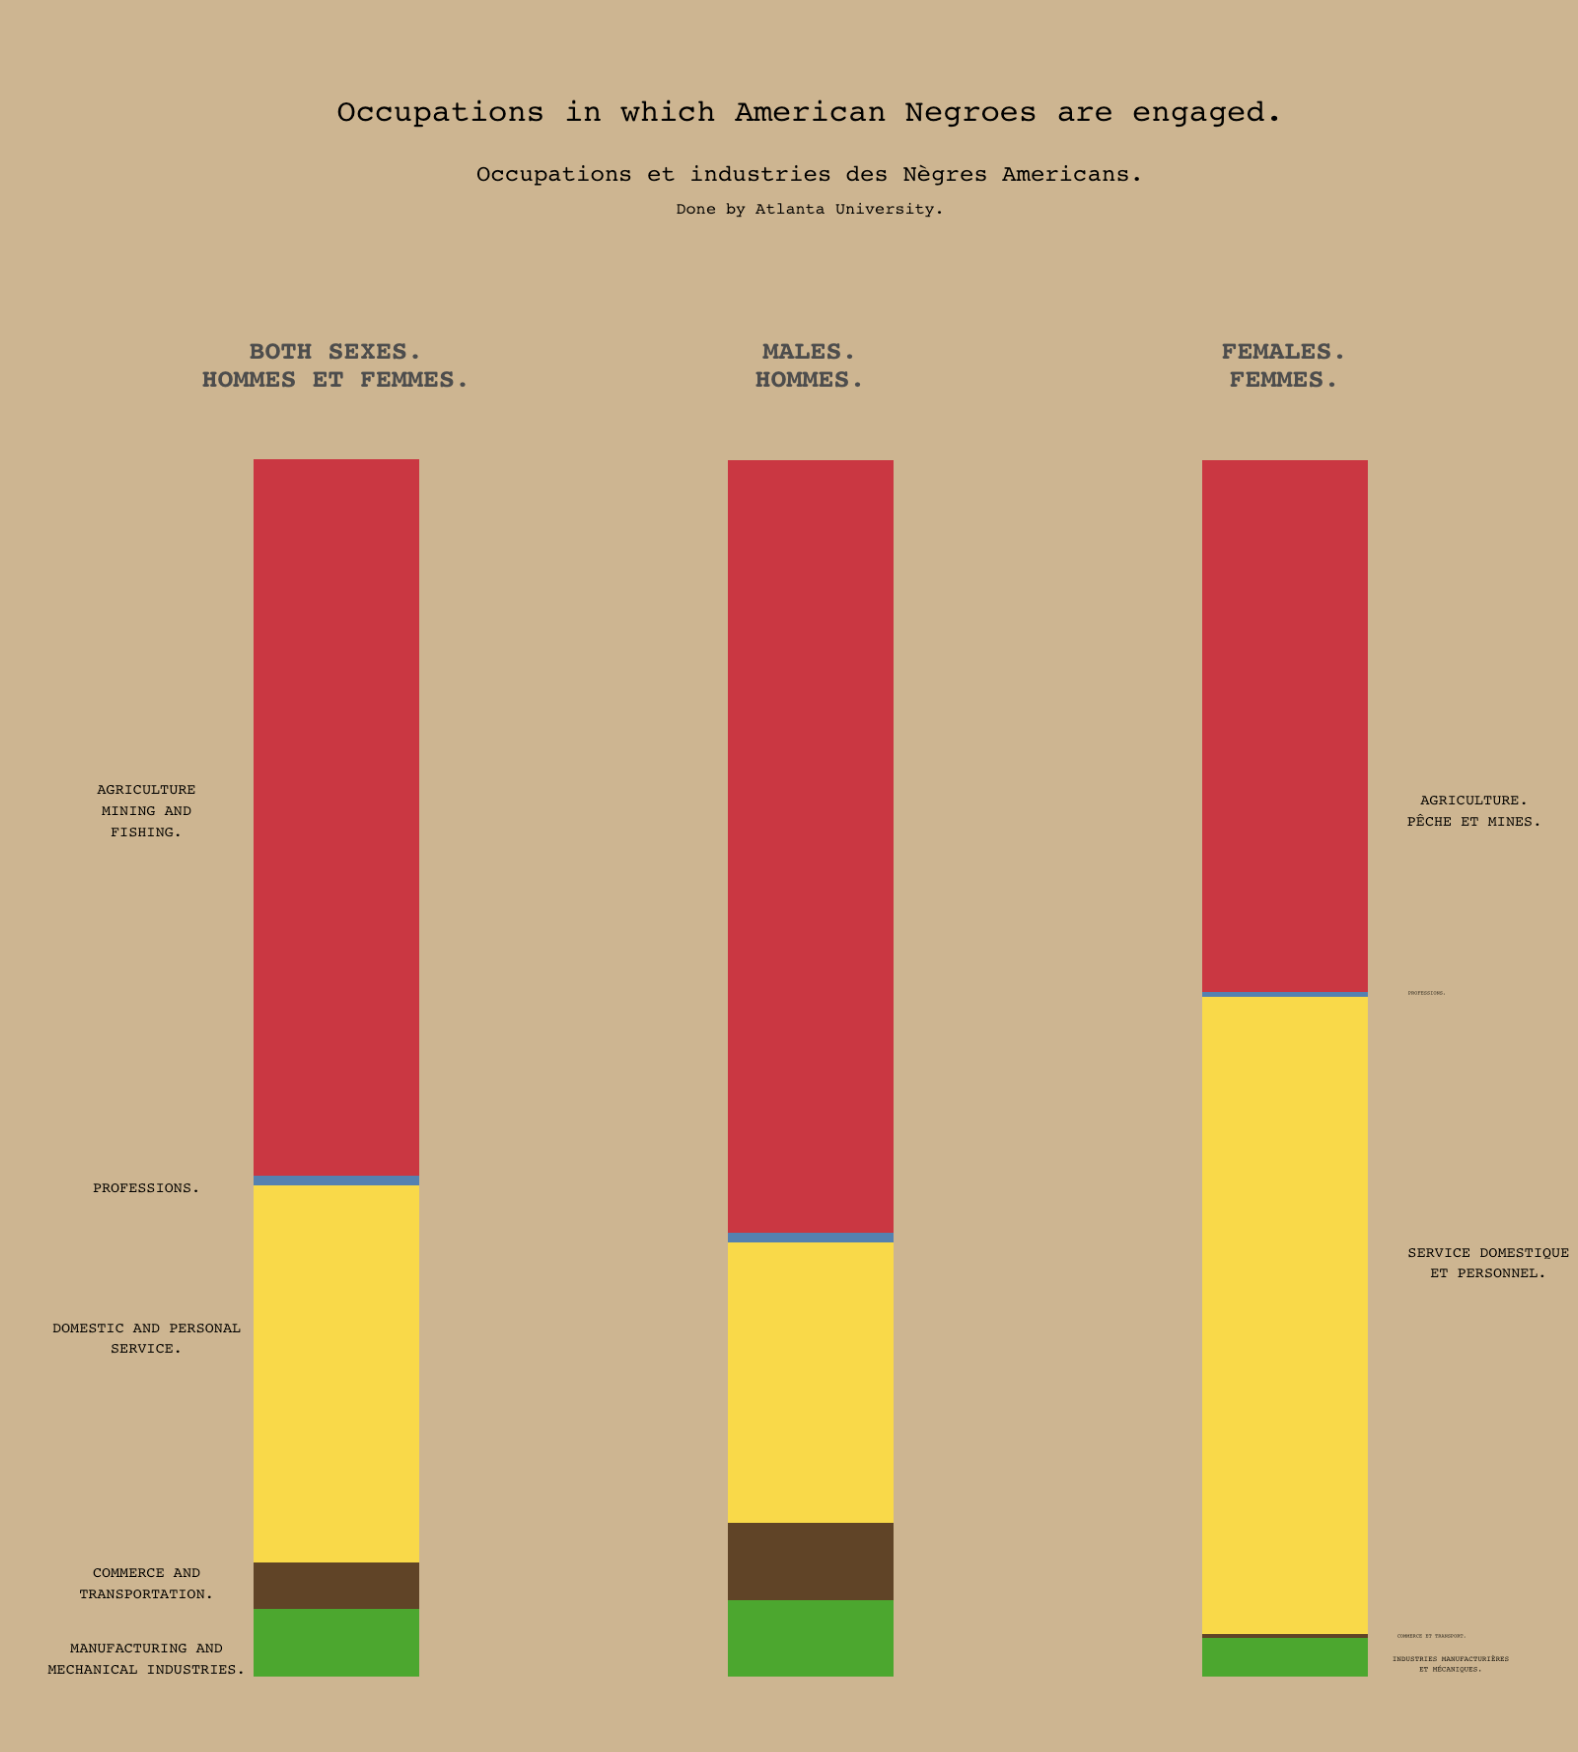
Spiralize might be useful for Du Bois style spiraling bar charts as well.
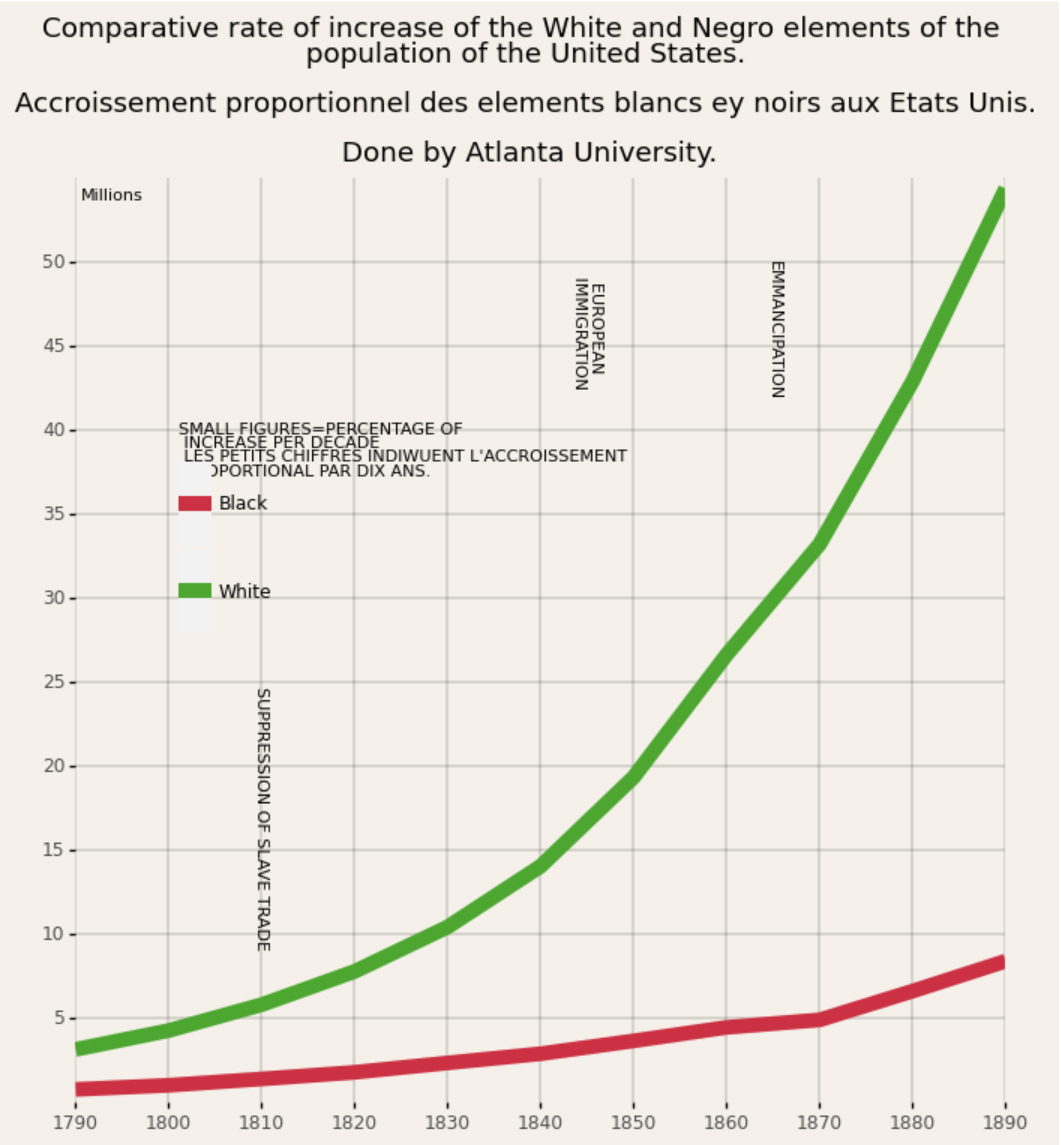
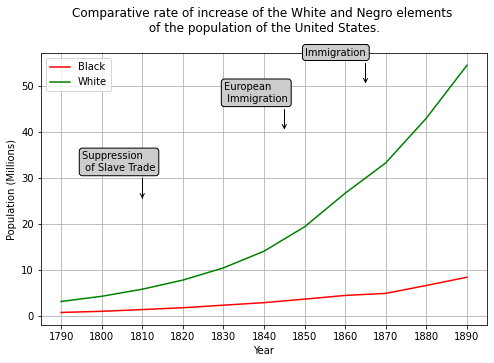
Du Bois reconstruction - Ryan McNeil
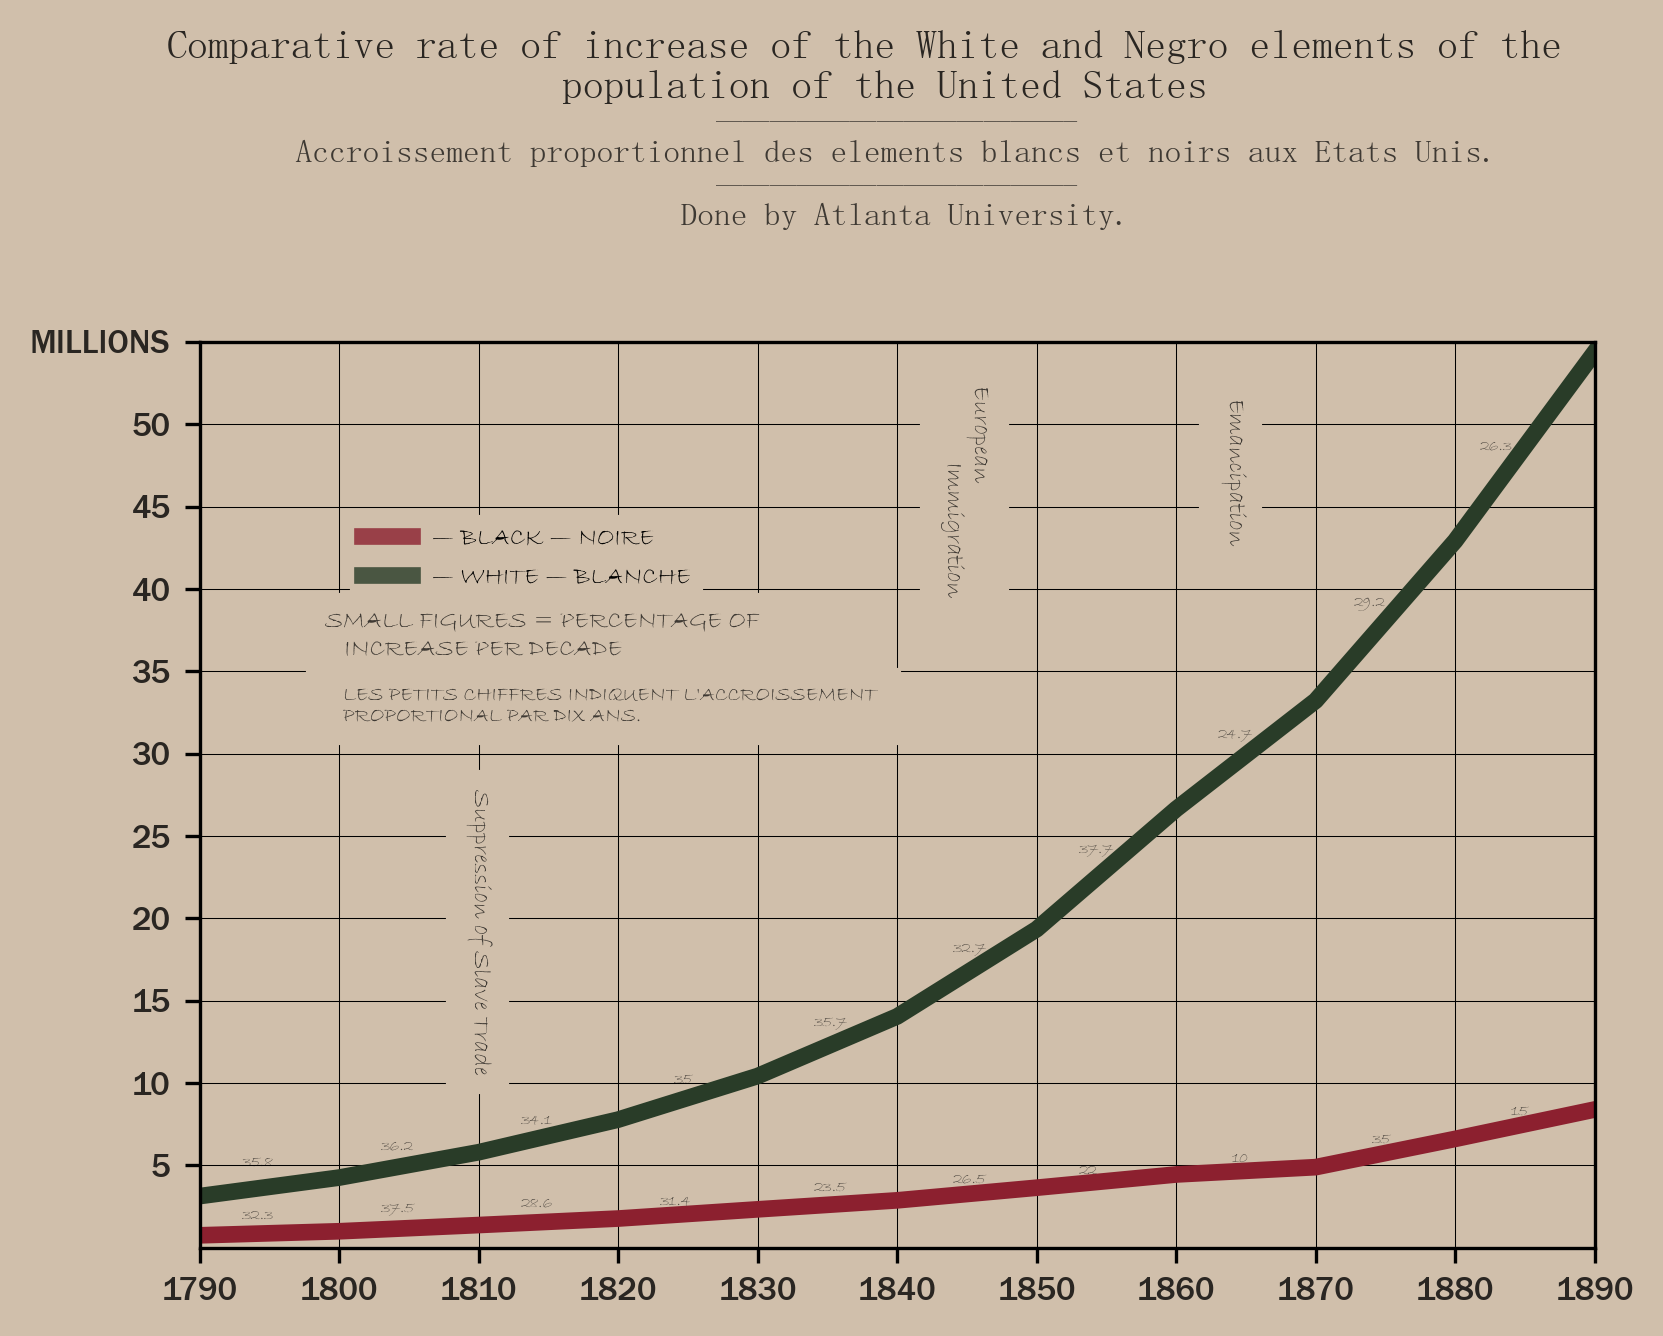
Du Bois reconstruction - Paul Ayamah
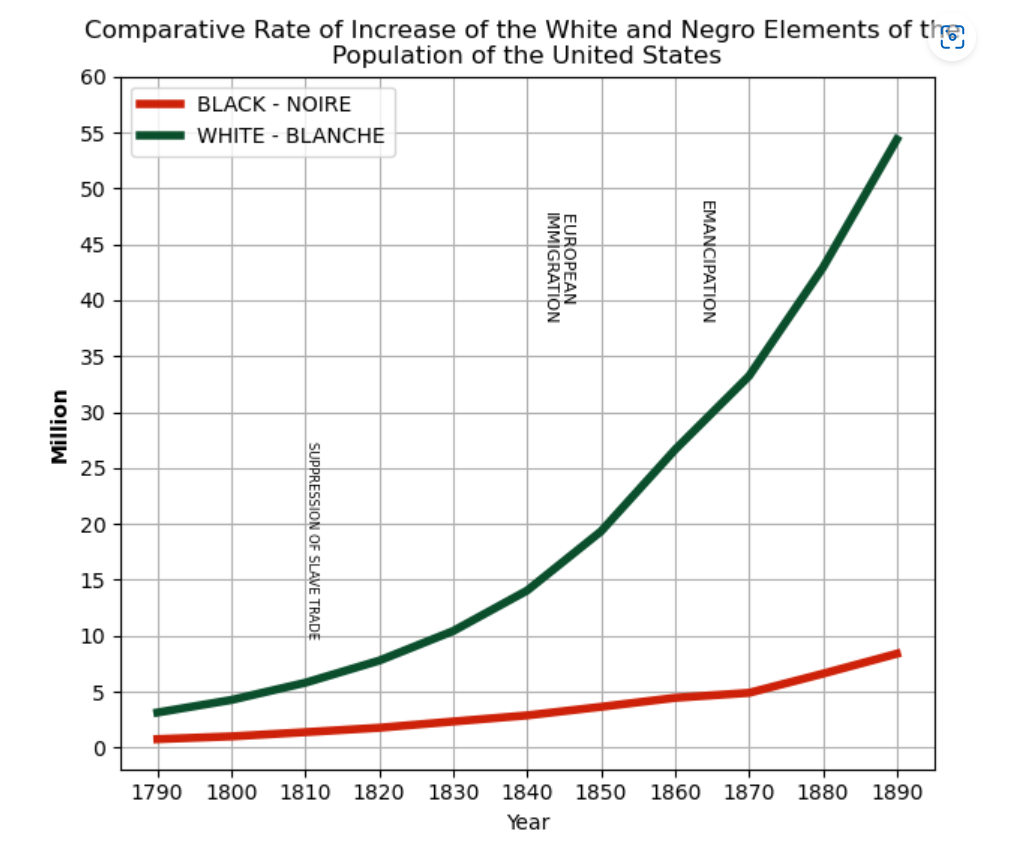
Du Bois reconstruction - Garima Goyal
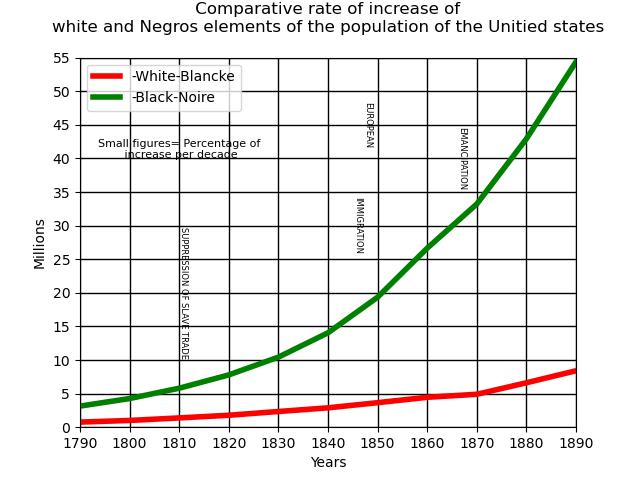
Du Bois reconstruction - Sean Sudol
Du Bois reconstruction - Jordan Matuszewski
Du Bois reconstruction - Giacomo Radaelli
Du Bois reconstruction - Neh Majmudar
Du Bois reconstruction - Mahfal Naleemul Rahuman
Du Bois reconstruction - Joshua Rollins
Du Bois reconstruction - GiBeom Park
Bertin - Semiology of Graphics
Jacques Bertin breaks down a graphic display and its design:
On the abstract end, the invariant of the graphic - the idea, concept or topic that unifies all visual marks.
More concretely, the variable features are the components of the invariant.
Each component consists of atomic parts, called elements.

Bertin - Semiology of Graphics
Jacques Bertin breaks down a graphic display and its design:
Six fundamental visual variables:
- Size, together with position are the only variables that convey quantitative information
- Value, far superior to color for communicating order
- Pattern
- Color, with orientation and shape function best for visual association and building groups
- Orientation
- Shape

Bertin - Semiology of Graphics
Jacques Bertin breaks down a graphic display and its design:
Three questions a graphic should answer:
- Elementary - focuses on a specific element of the graphic, eg reading a single scatter plot dot, or an annotation.
- Intermediate - focuses on a group of elements, usually illuminates a trend.
- Overall - Seeks an answer to the general message of the graphic.
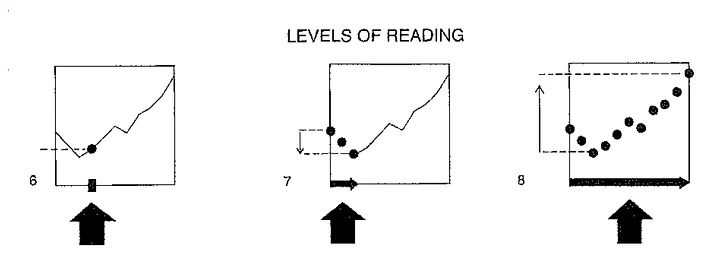
A graphic that can do all three at once is called efficient.
Visual marks and their efficiency
Building further from Bertin’s abstraction, the community has developed a richer language of visual marks and their properties.
Munzner discusses points, lines and areas.
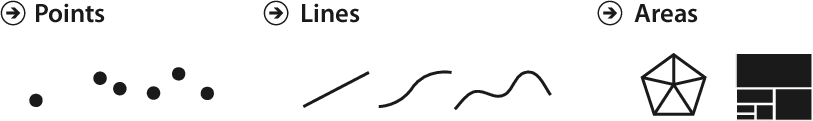
Wilkinson discusses a wider range, including intervals, paths, schemas; polygons, contours; and edges - all of them in 1, 2 or 3 data dimensions.
Next week we will look deeper into various properties of geometric marks, and the perceptual efficiency of communicating different kinds of information through the different visual channels.
Munzner’s 4 Levels
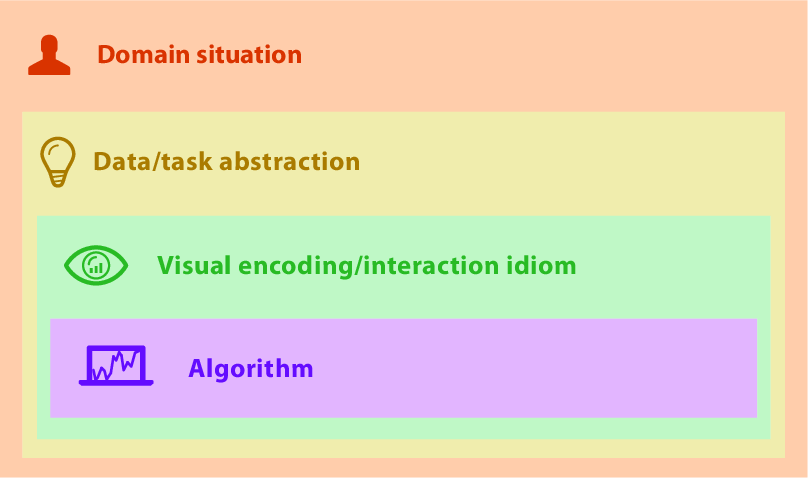
Munzner’s 4 Levels
Each of the 4 levels suggests different failure modes, different modes of study, analysis and validation, and different approaches to improving a design.
