Lecture 3: Task Abstraction

Today’s Visualization
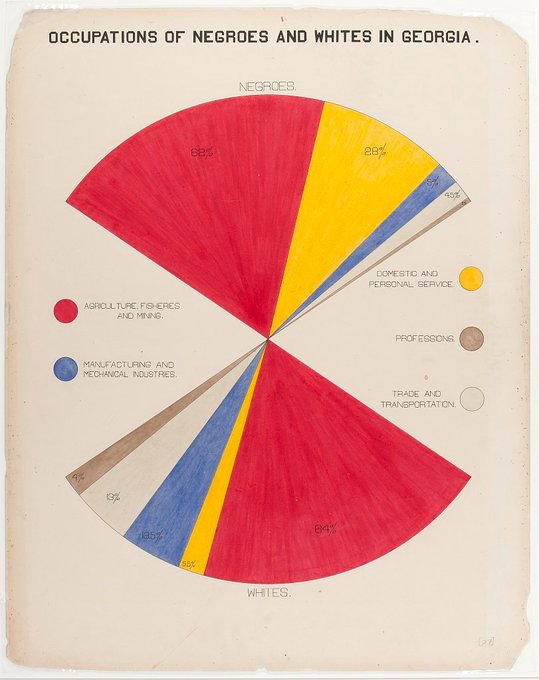
W. E. B. Du Bois

First African American to earn a doctorate from Harvard, went on to professor of history, sociology and economics at Atlanta University.

One of the founders of the NAACP.

Organized The Exhibit of American Negroes at the Exposition Universelle in Paris in 1900, with 363 photographs and a number of charts, graphs and maps documenting and commemorating the lives of African Americans at the turn of the century.

This week, Anthony Starks launched the 2023 edition of the #DuboisChallenge2023

Homework Pick one of this year’s 10 challenge graphics as described on https://twitter.com/ajstarks/status/1622587992710737920 and recreate it on your platform, as precisely as possible.

Explore https://twitter.com/ajstarks for several helpful links, including a GitHub repository with the data for all the figures.

Why?: Task Abstraction

Task = Action + Target

Munzner breaks down Task Abstraction into Action Verbs and Target Nouns.

Action Verbs

  • Analyze
    • Consume
      • Discover, Present, Enjoy
    • Produce
      • Annotate, Record, Derive
  • Search
    • Lookup, Browse, Locate, Explore
  • Query
    • Identify, Compare, Summarize

Target Nouns

  • All Data
    • Trends, Outliers, Features
  • Attributes
    • One
      • Distribution: Extremes
    • Many
      • Dependency, Correlation, Similarity
  • Network Data
    • Topology: Paths
  • Spatial Data
    • Shape

Three Levels of Actions

Munzner uses Analyze, Search and Query as levels of an action taxonomy:

Analyze concerns the high-level goals of the user

Search focuses on the need to locate interesting items within the displayed data

Query looks at different aspects of the extraction of information from a visualization.

Analyze

A user may want to either Consume information already generated, or Produce new material for some purpose.

The Consume analysis goal subdivides into

  • Discover - use vis to find new knowledge that was not previously known.
  • Present - help the user communicate something to someone: telling a story with data, or guiding an audience through a series of cognitive operations.
  • Enjoy - casual interactions with a data visualization

Important

The Discover goal is not allowed in your semester project.

Analyze

A user may want to either Consume information already generated, or Produce new material for some purpose.

The Produce analysis goal subdivides into

  • Annotate - augment some pre-existing visualization elements with additional graphical or textual annotations.
  • Record - save or capture visualization elements as persistent artifacts. These include screen shots, bookmarked elements or locations, parameter settings, interaction logs, or annotations.
  • Derive - produce new data elements based on existing data elements, sometimes driven by observations from previous visualizations. Also called transform.

Query

Finally, once the items of interest have been found, the user is likely to want to extract some sort of detail information from the visualization.

Munzner splits this level into categories based on the number of targets considered:

  • Identify - extract characteristics or references for a single target
  • Compare - compare multiple targets to each other
  • Summarize - also known as overview, provide a comprehensive view of all the data

Targets

The Targets are the aspects of the data of interest to the user - it is the thing on which the chosen actions acts.

Munzner describes 4 abstract target kinds, 1 set that applies very broadly, 1 that applies to anything that carries attributes, and 2 specialized domain target types:

  • All Data: In general, a user might be concerned with finding trends (or patterns), finding outliers (or anomalies, novelties, deviants, surprises), and finding features (the exact definition is task dependent)
  • Attributes: A user may be interested in studying:
    • a single attribute (to model its distribution and sometimes particularly to model its extremes),
    • several attributes (to model their dependencies, measure correlation or measure similarity)
  • Network Data: A user interacting with network data specifically may be interested in studying aspects of its topology (connection patterns) - and may in particular be interested in finding or analyzing paths through the topology.
  • Spatial Data: A user interacting with spatial data may be interested in studying shapes of things.

Task Abstraction Exercise

Task: Open up https://new.mta.info/document/59281, one of the proposed redesigns of the MTA transit maps.

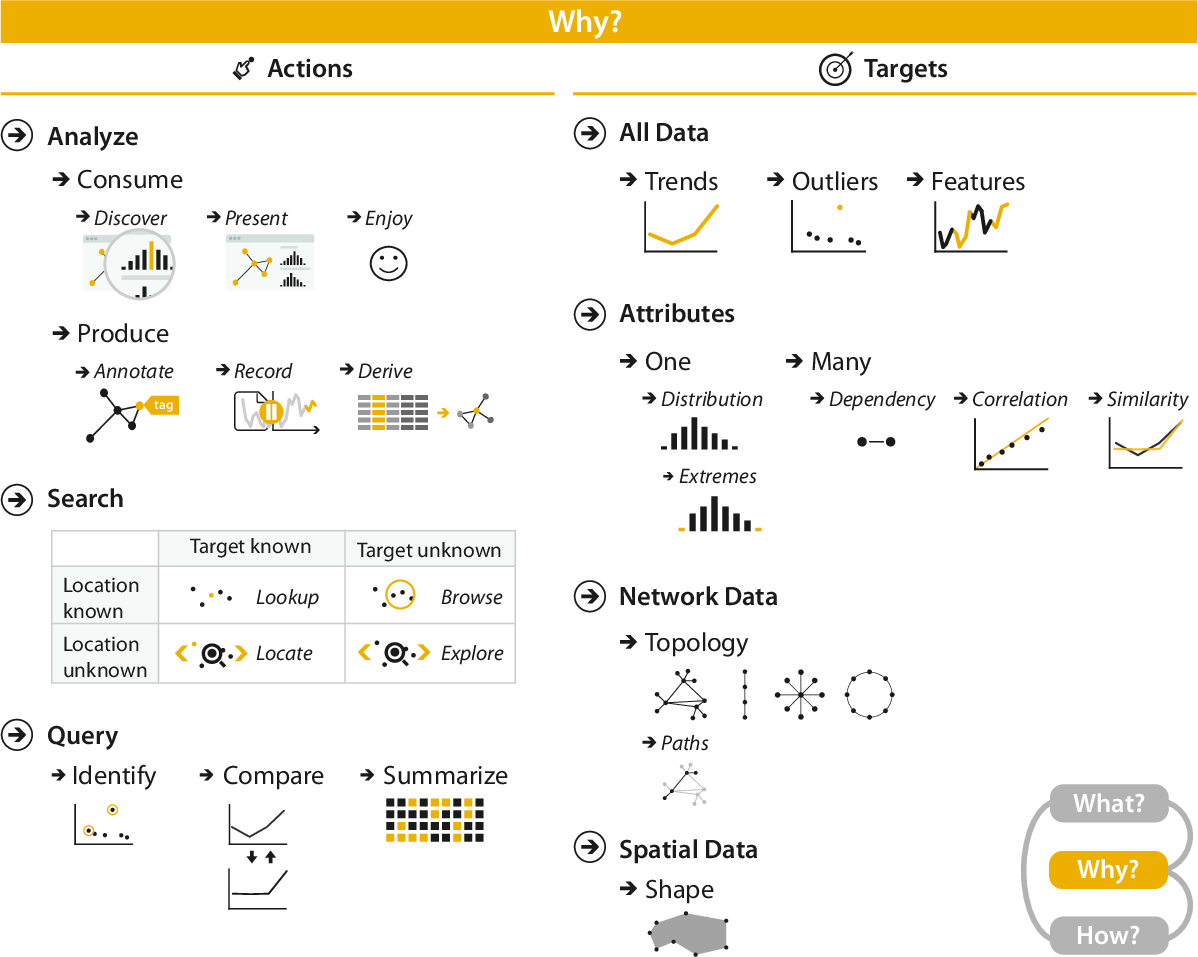
Work in pairs: Articulate at least 4 different tasks that this map helps a user perform. Each task combines 1 action with 1 target. Also include a domain-adapted description.

Task Abstraction Exercise

MVJ examples:

  • “Figure out how to get to La Guardia airport after teaching on Staten Island.” - Discover a Path in the Network Data.
  • “Explain to someone how to get to my home from Penn Station.” - Present a Path in the Network Data.
  • “Play Subwaydle.” - Enjoy either Lookup or Explore a Path in the Network Data.
  • “Find the nearest subway police station.” - Locate a Single Attribute value.

Grammar of Graphics Breakdown

Work in pairs. Write down a full specification of this graphic following Wilkinson’s Grammar of Graphics:

  1. Data
  2. Variable Transformations
  3. Scale Transformations
  4. Coordinate System
  5. Graphical Elements and how their attributes connect to the data
  6. Guides

NY Times: Four Charts that reveal Tom Brady’s Greatness

Semester Project: Popularizing Blog Post

This component of the course builds on course design work by Niklas Elmqvist.

  1. You will read one paper out of the past 6 years of Best Paper awarded papers at IEEE Vis.
  2. You will summarize the paper in a blog post, 600-800 words in length, published on Medium.
  3. You will be graded on:
  • Ability to convey complex scientific information in a simple and straightforward manner
  • Appropriate length (between 600 and 800 words)
  • The effective use of one or two images to illustrate the work
  • Effective and high-quality language

Semester Project: Popularizing Blog Post

Detailed guidelines are available on Blackboard. Overall Procedure:

  1. Open the link https://www.signupgenius.com/go/10C0F45A5AF28A3F4C43-cuny1 to the list of available papers, and pick one. Use the access code CUNYGCVis2023 to access the list.
  2. Find the full text of the paper through the Vis conference websites or Google Scholar or the GC library (etc…)
  3. Create a free Medium account (if you do not already have one), and tell me (in email for instance) your account name so I can include you in the course publication
  4. Write your blog post on Medium
  5. Submit your (written, and published) post to the course publication
  6. Wait for my feedback
  7. Revise the post as needed.