Lecture 12: Manifolds, Dimensionality Reduction
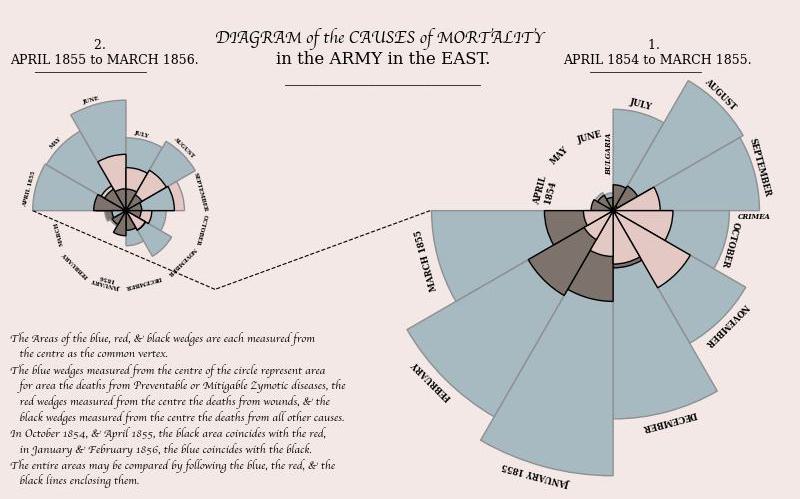
Historical Timeseries: Ryan McNeil
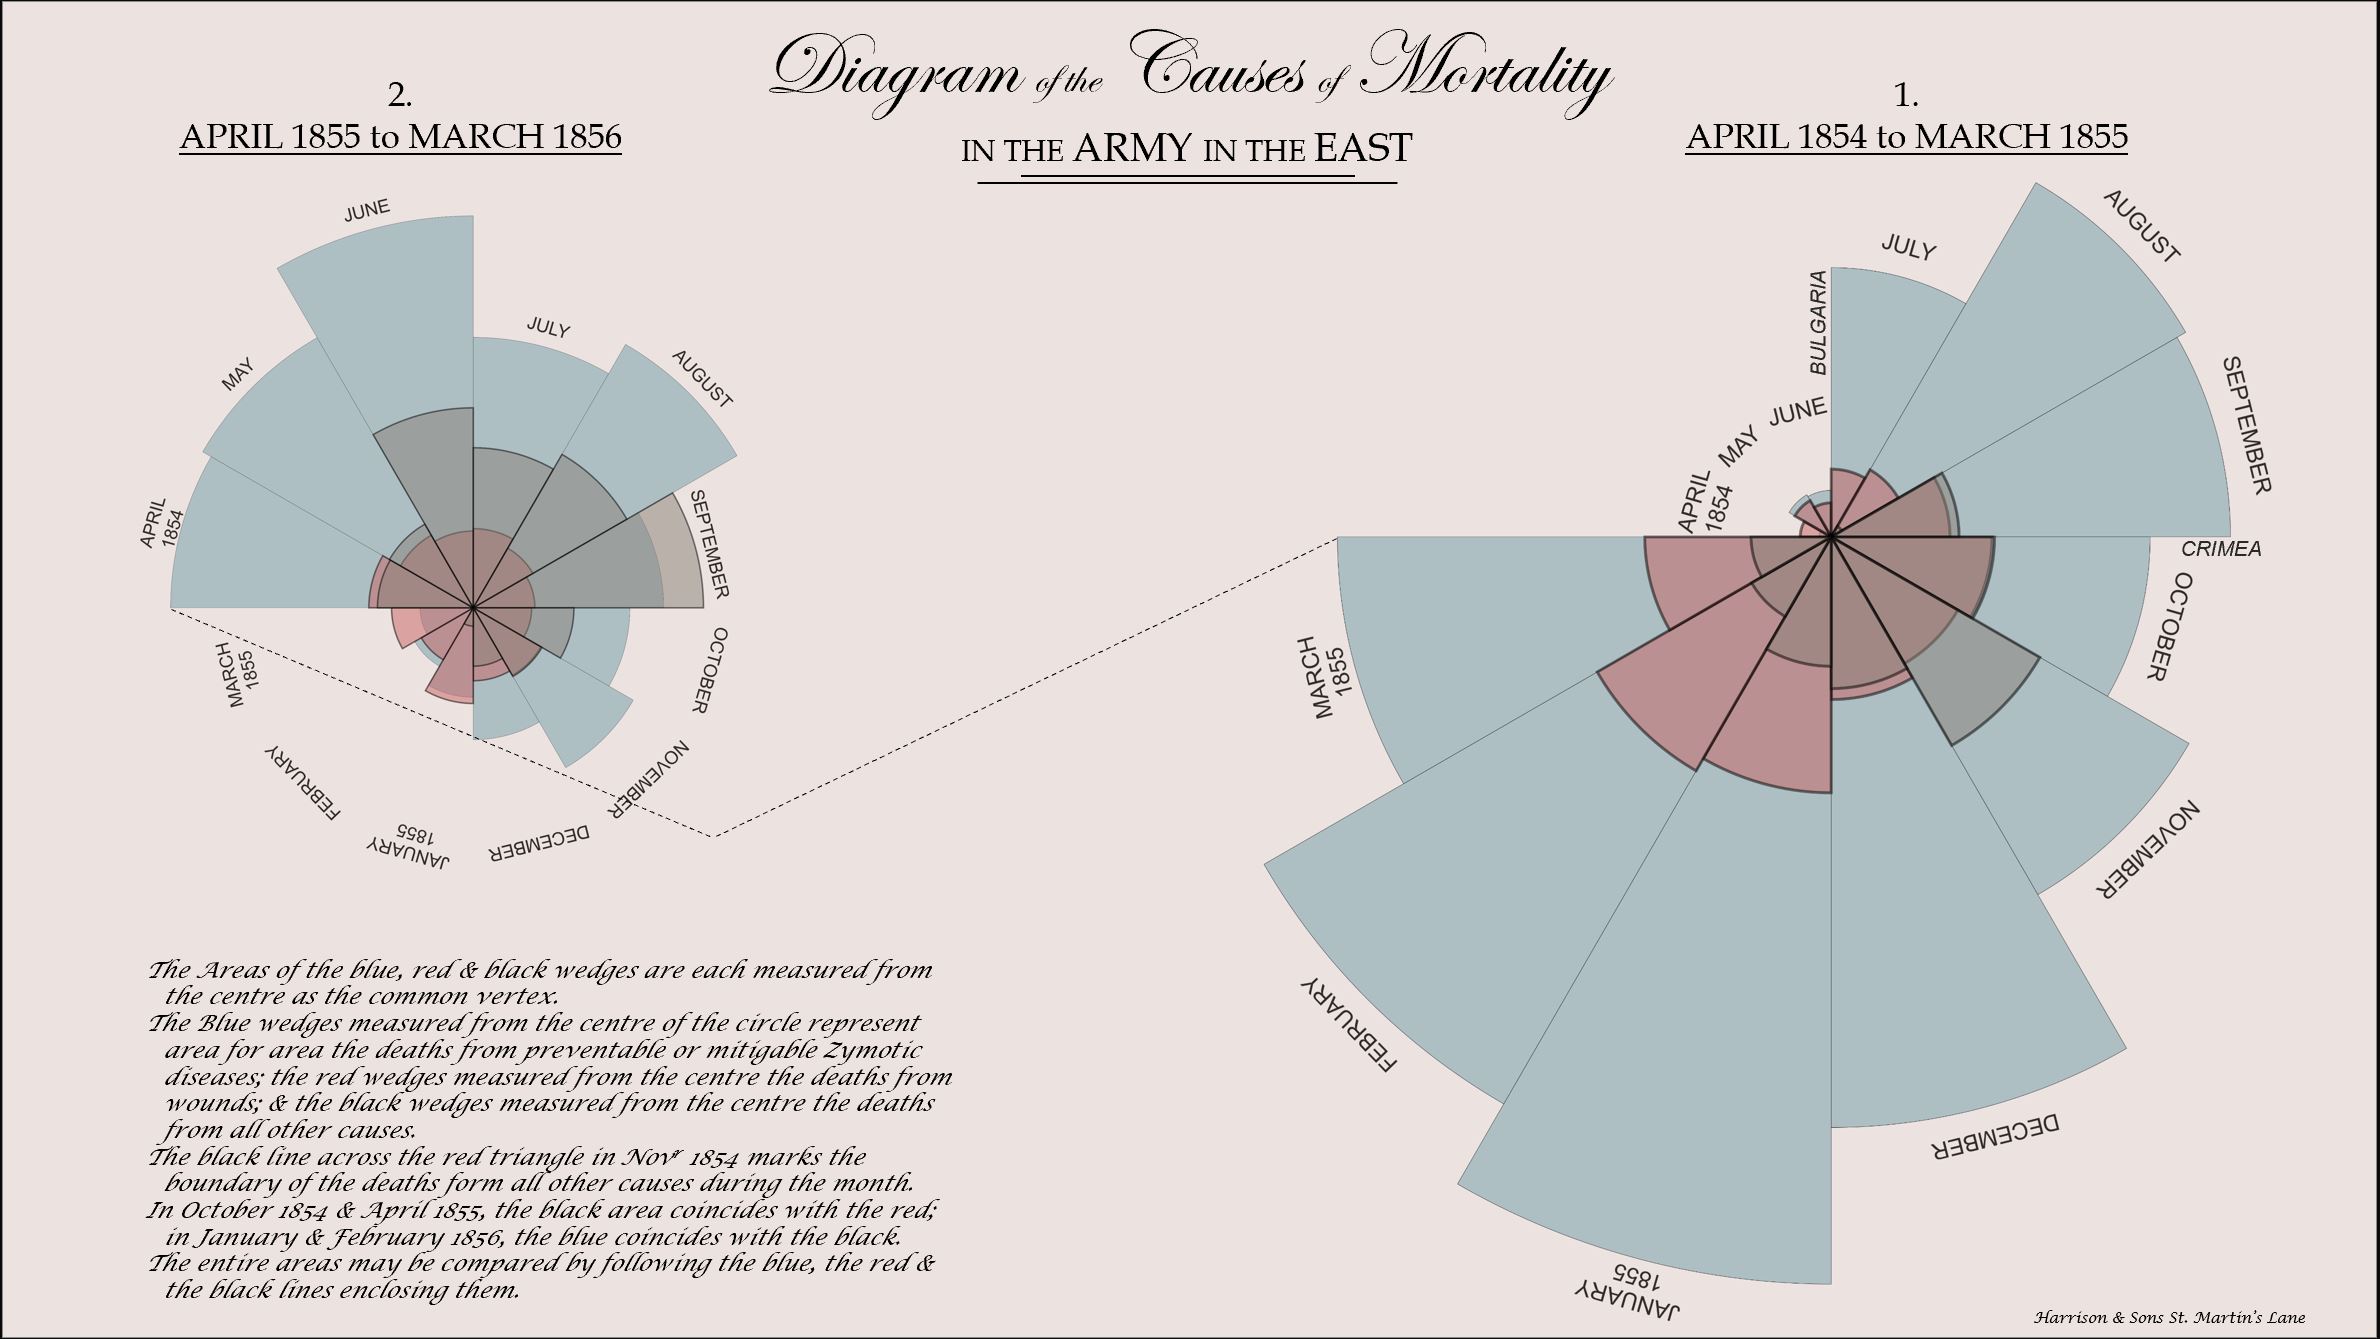
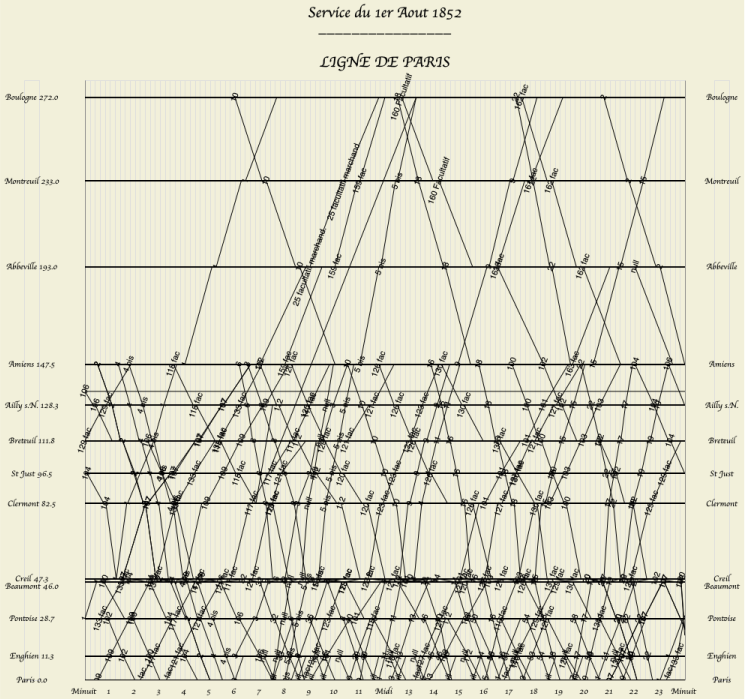
Historical Timeseries: Paul Ayamah
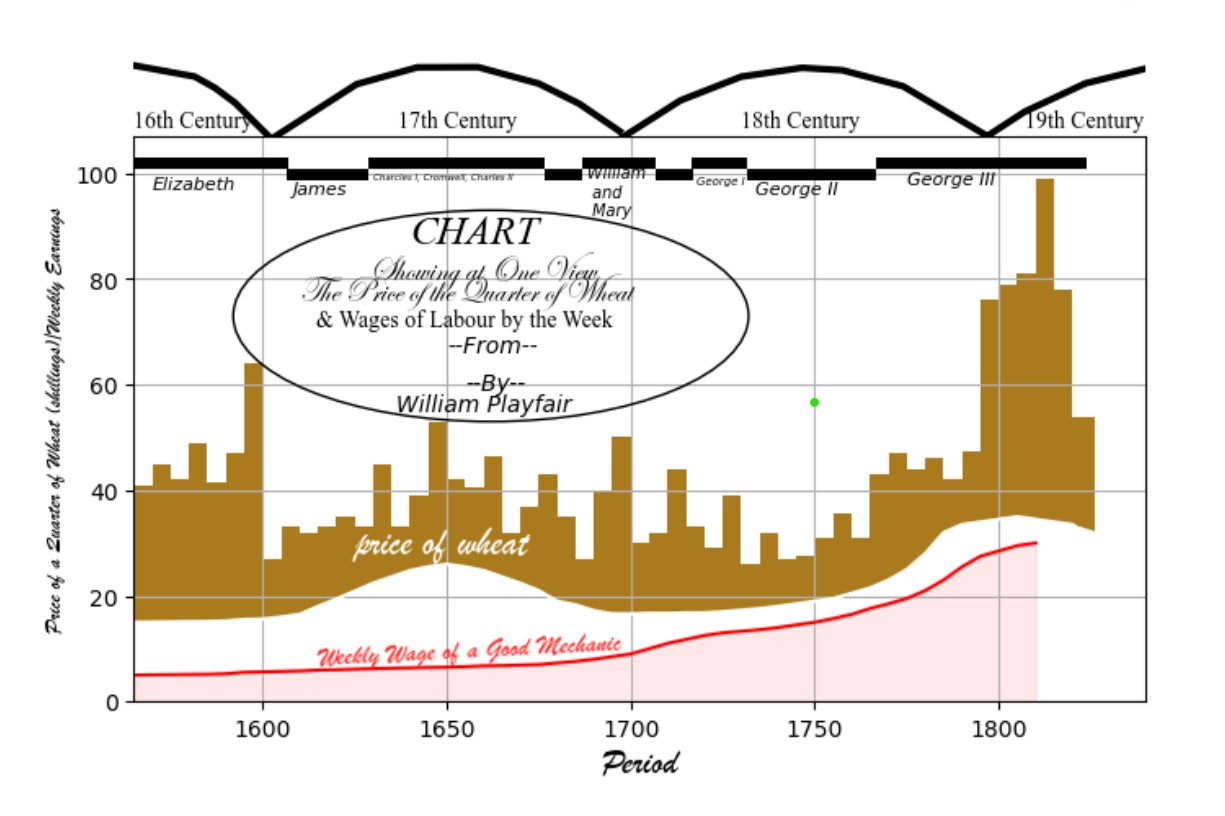
Historical Timeseries: Sean Sudol
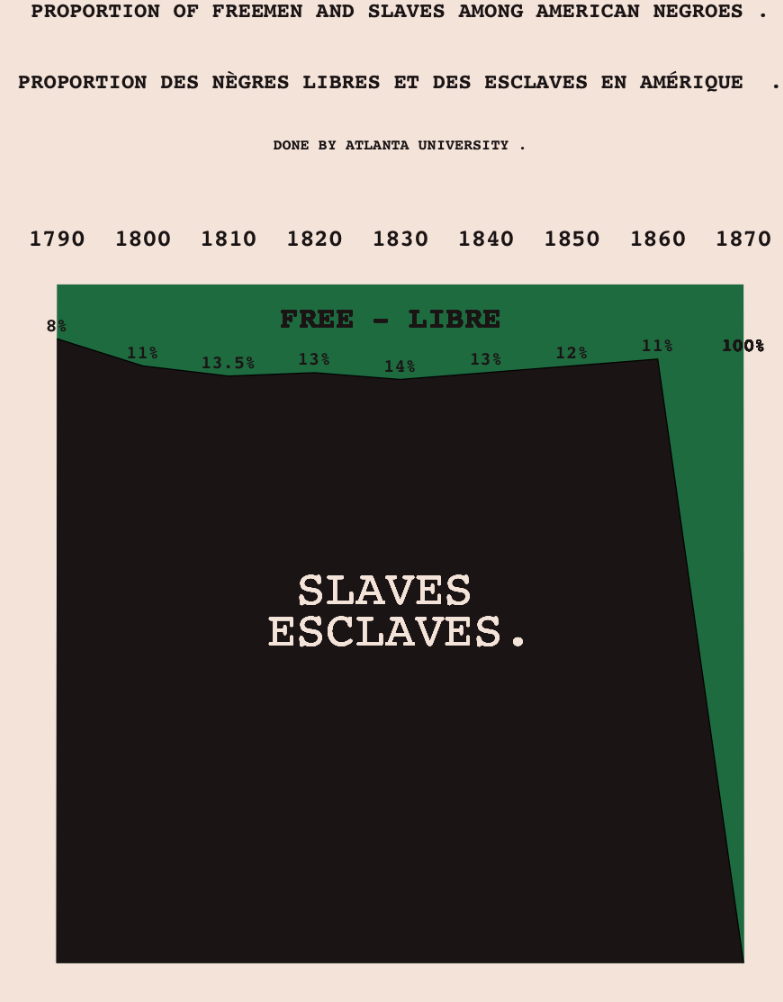
Historical Timeseries: Giacomo Radaelli
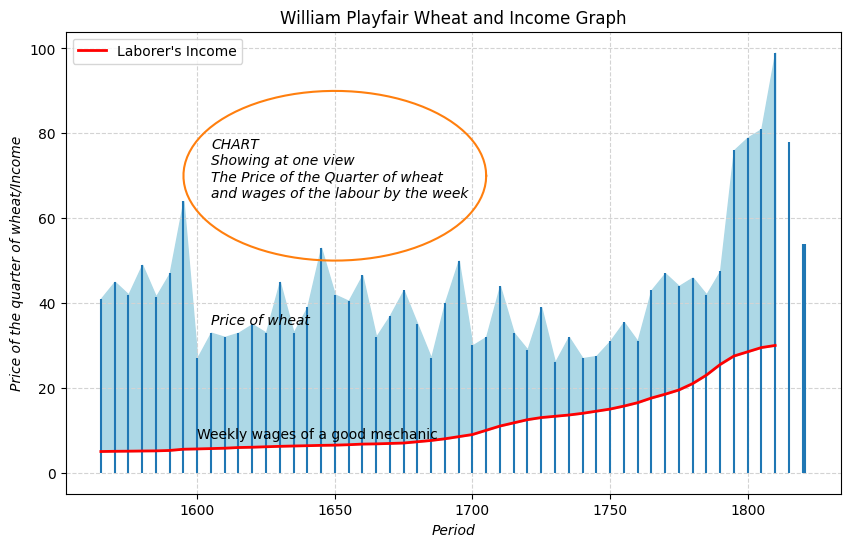
Historical Timeseries: Joshua Rollins

Historical Timeseries: Jordan Matuszewski
Historical Timeseries: Garima Goyal
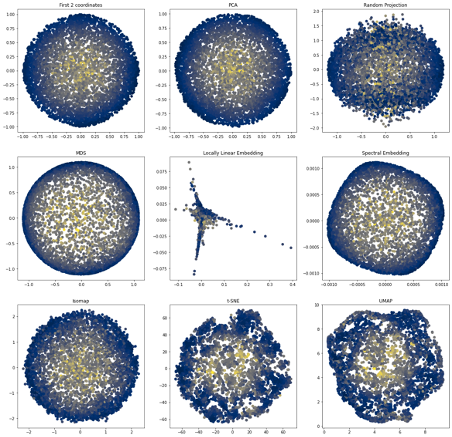
Dimensionality Reduction in Action
From a database (collected by van Hateren) of naturally occurring images, draw 3x3 pixel patches at random.
Most such pixel patches will be almost constant - discard those.
D Mumford et al. used PCA to identify a primary circle of high density in this data. Turns out to trace linear gradients in different orientations.
G Carlsson et al. used Topological Data Analysis to study the high-density structure more carefully. They identify a high-density Klein bottle in the data, with a direct correspondence to quadratic gradients (ridges and valleys) in different orientations.