gganimate extends ggplot2 with an animation grammar:
transition_*() - specify how data should spread and relate across time
view_*() - specify how positional scales should change along the animation
shadow_*() - specify how data from other points in time should be present (…maybe you want to leave trails of the last \(n\) observations?)
enter_*() and exit_*() - specify how new data appears and old data disappears
ease_aes - specify easings for specific aesthetics
Easing refers to the way you start and stop a motion. You could just interpolate linearly between start and end state, but by using a smoother function, a more fluid and easier to track display may be achieved.
Options include "linear", "quadratic", "sine", "circular", "elastic", "back", "bounce", each with a suffix of -in, -out or -in-out to specify where the easing should happen.
Write a function that creates (or changes) the plot given a frame-number
Instantiate FuncAnimation together with an appropriate file writer
Run animationInstance.save("filename.gif", writer=writer) for one of the file writer options
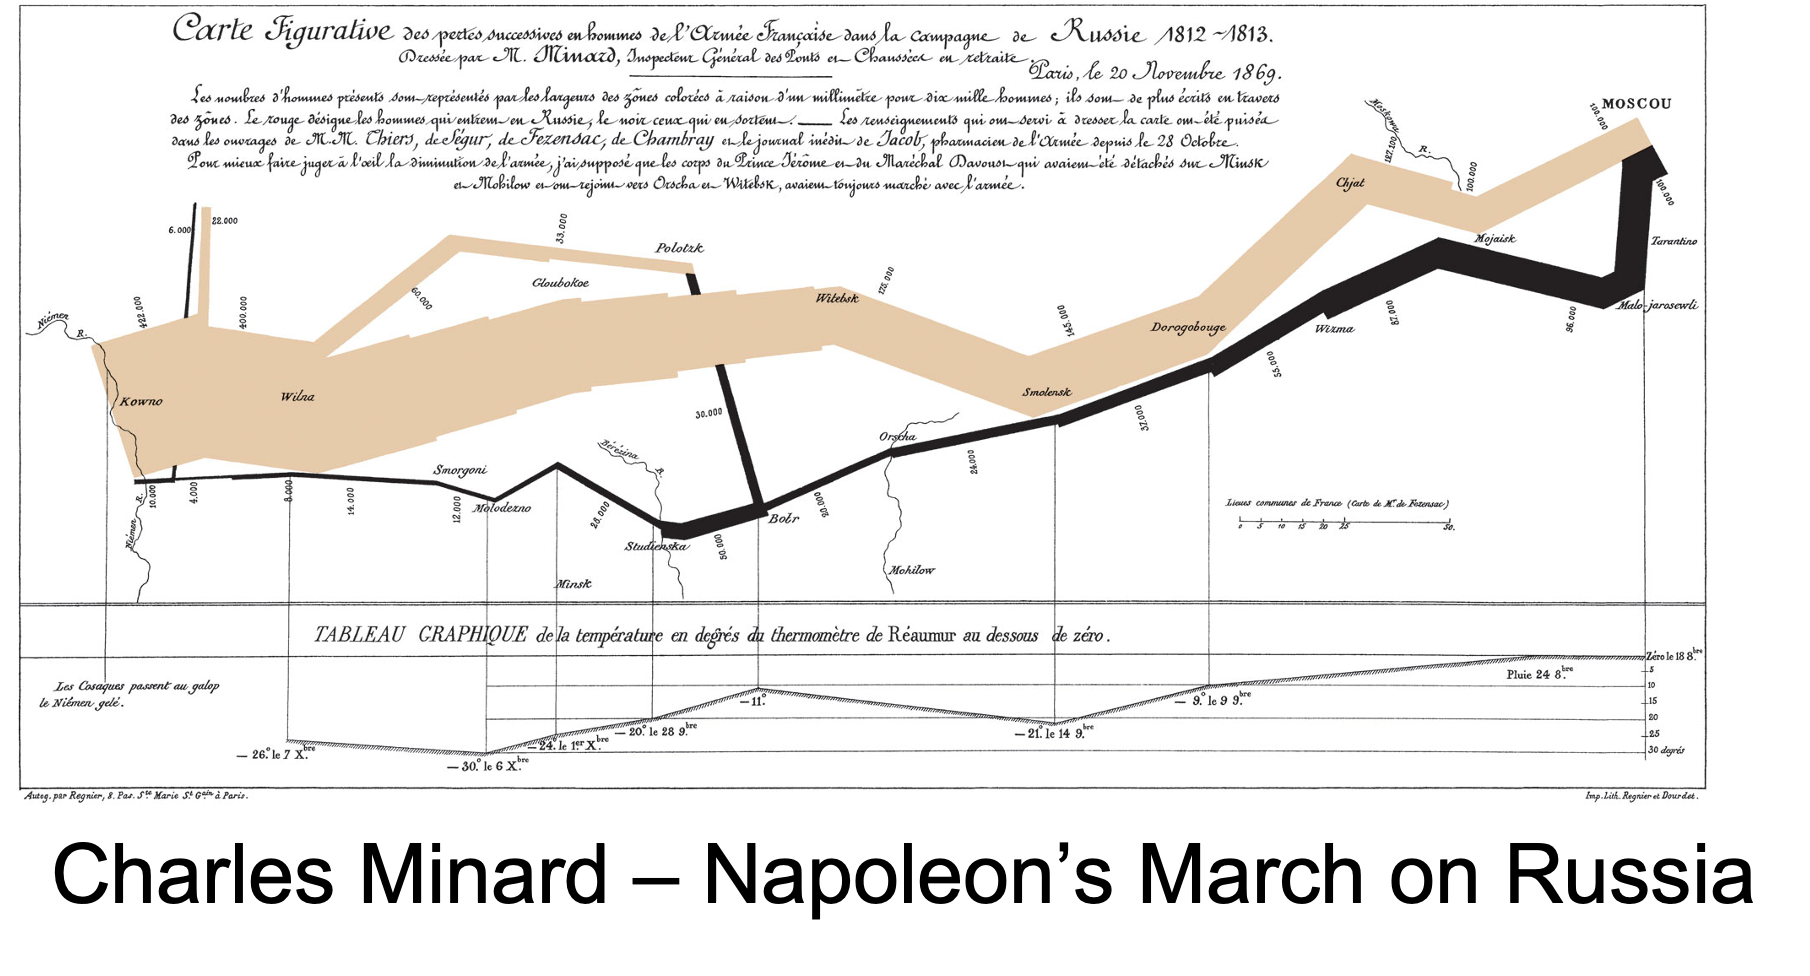
Movement for Time
Animation in altair
Is not well-supported. Seems like the best option is to generate each frame separately and combine them either with a fairly large amount of javascript work or by exporting each chart to a picture and building an animated gif (or video file) with a python library like imageio or Pillow
Animation in Visualization
Animation grabs attention
Even in peripheral vision: excellent for alerting the user
Animation can help maintain object identity across transformations
Accuracy depends on speed – both too fast and too slow can be harmful
Heer and Robertson (2007) suggest a taxonomy of animated transitions:
View transformations – zooming, panning
Substrate transformations – change the spatial canvas where marks are embedded; axis-rescaling, log transforms, fisheye distortions
Filtering – changing which elements should be visible according to a logical predicate; elements may be added or removed
Ordering – rearrange ordinal data dimensions; sorting on attribute values, manual reordering
Timestep – apply temporal changes to data values; eg change from one year to the next
Visualization change – changes to the visual mappings applied to the data; bar chart to pie chart, or changing palettes and mapping schemes for color, size, shape encodings
Data Schema change – changes to the data dimensions being visualized; adding additional data columns, roll-up or drill-down operations
Animation in Visualization
Heer and Robertson adapt Tversky et al’s (2002) principles of Congruence and Apprehension for effective animation:
Maintain valid data graphics during transitions. As much as possible, keep all intermediate interpolation states to valid data graphics.
Use consistent semantic-syntactic mappings. Similar transitions should have similar appearances across different underlying types, to increase consistency and learnability.
Avoid ambiguity. Make different operators have noticeably different transitions.
Group similar transitions. Objects that go through similar visual changes are more likely to be perceptually grouped.
Minimize occlusion. Occluding breaks tracking.
Maximize predictability. If the viewer can predict the end state based on seeing parts of the transition, it reduces cognitive load and improves tracking. Slow-in slow-out timings emphasize starting and ending states and improves spatial and temporal predictability.
Use simple transitions. Translation and expansion/contraction motions are easier to understand than rotation.
Use staging for complex transitions. Break up complex transitions into simple components. Example: separate axis rescaling from value changes.
Make transitions as long as needed, but not longer. Transitions must be long enough that we can track changes, but not so long that the viewer grows bored and disengages. Transitions around 1 second have been recommended in the research literature.
Storing Time Information
Notation varies regionally, sometimes drastically, sometimes confusable:
7/5/11 - what date does this represent?
11:25 pm vs. 23:25
Week starts on…?
Standards for Dates and Times
Standardized Notation for dates and times is specified in ISO 8601 (also RFC 3339).
Components ordered by decreasing length
24h clock system
0-padded to expected precision
Time Zone denoted with ± UTC offset
Gregorian (not Julian) calendar
May or may not include added separators
use - for the date portion, : for the time portion
May be truncated for reduced precision
2023-04-03T14:00-05:00 or 230403T1145-0500 both valid.
Computer Storage of Date-Times
Very broadly in use are versions of UNIX Time / epoch time / time stamps. These systems represent time as a count of time units since a specified start date-time. Both resolution (how long is the time unit) and epoch (when does it start) varies with operating system and platform. Fundamental building block for computer time keeping.
UNIX, POSIX
seconds since 1 Jan 1970
until 19 Jan 2038 (using signed 32-bit integers; Y2k-type effects visible today)
until 2 July 2486 (using unsigned 32-bit integers)
until 4 Dec 292 277 026 596 (using 64-bit integers)
macOS, iOS (Mac computers, iPhone, iPad)
<1ms steps. 1 Jan 2001 ± 10 000 years
Windows
1ms or 100ns ticks
1 Jan 1601 to 31 Dec 30827 using a struct with separate fields for components of the date-time
Excel
epoch is 1 Jan 1900
Java, Android, JavaScript
1ms ticks since 1 Jan 1970
SQL
3ms steps 1 Jan 1753 - 31 Dec 9999
60s steps 1 Jan 1900 - 6 June 2079
Commonly occurring calendars
Solar
Gregorian
Introduced 1582. Adjusts year length from 365.25 days to 365.2425 days. Epoch is claimed to be the birth of Jesus Christ.
Later dates often indicated by CE (common era) or AD (Anno Domini, referring to the religious source of the epoch). Pre-epoch dates often indicated by BCE (before common era) or BC (before christ).
Julian
Proposed by Julius Caesar, reforming the Roman calendar.
Pre-Julian calendar had 355-day years and commonly occurring “intercalary” months to catch up; plagued by political meddling and date confusion.
Month names largely preserved from the pre-Julian calendar: Martius (for the war-god Mars, start of the year), Aprilis (from aperio “to open”), Maius (for the Greek fertility goddess Maia), Iunius (for the goddess queen Juno), Quintilis, Sextilis, September, October, November, December (5th, 6th, 7th, 8th, 9th, 10th), Ianuarius (for the god Janus of beginnings and transitions), Februarius (for the Februa purification festival [later Lupercalia])
Quintilis was renamed Iulius to honor Julius Caesar. Sextilis renamed Augustus to honor Augustus Caesar.
Coptic, Ethiopian, Indian National, Solar Hijri
Commonly occurring calendars
Lunar
Hijri
Islamic religious calendar, 12 lunar months per year, 354 or 355 days per year. Epoch in 622 CE, the Hijrah, when Muhammad and followers moved from Mecca to Medina to establish a community.
Commonly occurring calendars
Lunisolar
Hebrew
Lunar months, solar year, 19-year cycle of intercalary months every 2-3 years to correct fo the short lunar years. Epoch is the creation of the world, according to Bereshit (Genesis)
Hindu, Bengali, Burmese, Thai Lunar
Chinese, Japanese, Korean, Mongolian, Tibetan
Timezones
And other quirks and pitfalls of working with time data
A Brief History of European Time
Ancient Egypt, Ancient Rome, etc
Day is divided into 24 units: 12 in the day, 12 in the night
1200s
Push towards equinoctial hours, and mechanical clocks.
1355
Equinoctial clock, bells struck every hour, hours even length documented in use in Milano
The Inception of Time Zones
The introduction of railway travel changed time needs: no longer could stops along the railway line run on local times (usually placing noon at the time when the sun is at its highest). Within England local times varied with up to 20 minutes before national standardization.
1853
Train collision in New England due to different train guards having slightly different times
1870
Dowd proposed time standardization with 4 time zones in the US.
1876
Sandford Fleming proposed worldwide time zones: 24 time zones, labeled by single letters, each covering 15 degrees longitude, 1h difference between zones.
1880
United Kingdom standardized time nationally.
1918
US Congress adopted standard time zones.
Time Zones across the world
Many countries adopted time relative to a local observatory, rather than time relative to Greenwich, UK.
1929
Most countries had hourly time zones
Iran, India, parts of Australia had 30-minute offsets wrt Greenwich
1986
Nepal standardizes to UTC+05:45
Time Zones keep changing
2018
Volgograd moves from UTC+03 to UTC+04
2020
Volgograd moves from UTC+04 to UTC+03 (Moscow Time)
2021
South Sudan changes from UTC+03 to UTC+02
Jordan changes system for DST
Samoa abolishes DST
2022
Iran abolishes DST
Jordan and Syria both abolish DST and settle on UTC+03
Mexico abolishes DST - except for areas near the US border
Fiji probably abolishes DST
2023
Most of Greenland moves from UTC-03 / UTC-02 to UTC-02 / UTC-01 after almost abolishing DST
Falsehoods Programmers Believe about Time
There are always 24 hours in a day
February is always 28 days long
Any 24-hour period will begin and end in the same day (week, month, …)
A week begins and ends in the same month.
A week (or month) begins and ends in the same year.
Time has no beginning and no end.
Human-readable dates can be specified in universally understood formats such as 05/07/11.
Timestamps will always be specified in the same format.
Timestamps will always have the same level precision.
A timestamp of sufficient precision can safely be considered unique.
A timestamp represents the time that an event actually occurred.
Years have 365 or 366 days
Falsehoods Programmers Believe about Time
The offsets between two time zones will remain constant.
OK, but timezone offsets won’t change in the future.
OK, but timezone changes will occur with plenty of advance notice.
Timezone offsets will always be an integer number of hours.
…of half-hours?
Daylight savings happens at the same time every year.
Daylight savings happens at the same time in every time zone.