An example with noise using R
Load the packages:
library(TDA)
library(deldir)
Let’s make another circular data set:
Z <- {
  theta <- runif(200, 0, 2*pi)
  radius <- runif(200, 0.9, 1)
  x <- radius * cos(theta)
  y <- radius * sin(theta)
  cbind(x, y)
}
Plot the data and the barcode:
plot(Z, pch=20, col="blue", asp=1)
PH.output <- alphaComplexDiag(Z)
PD <- PH.output[["diagram"]]
plot(PD, diagLim = c(0,1.5), barcode=TRUE)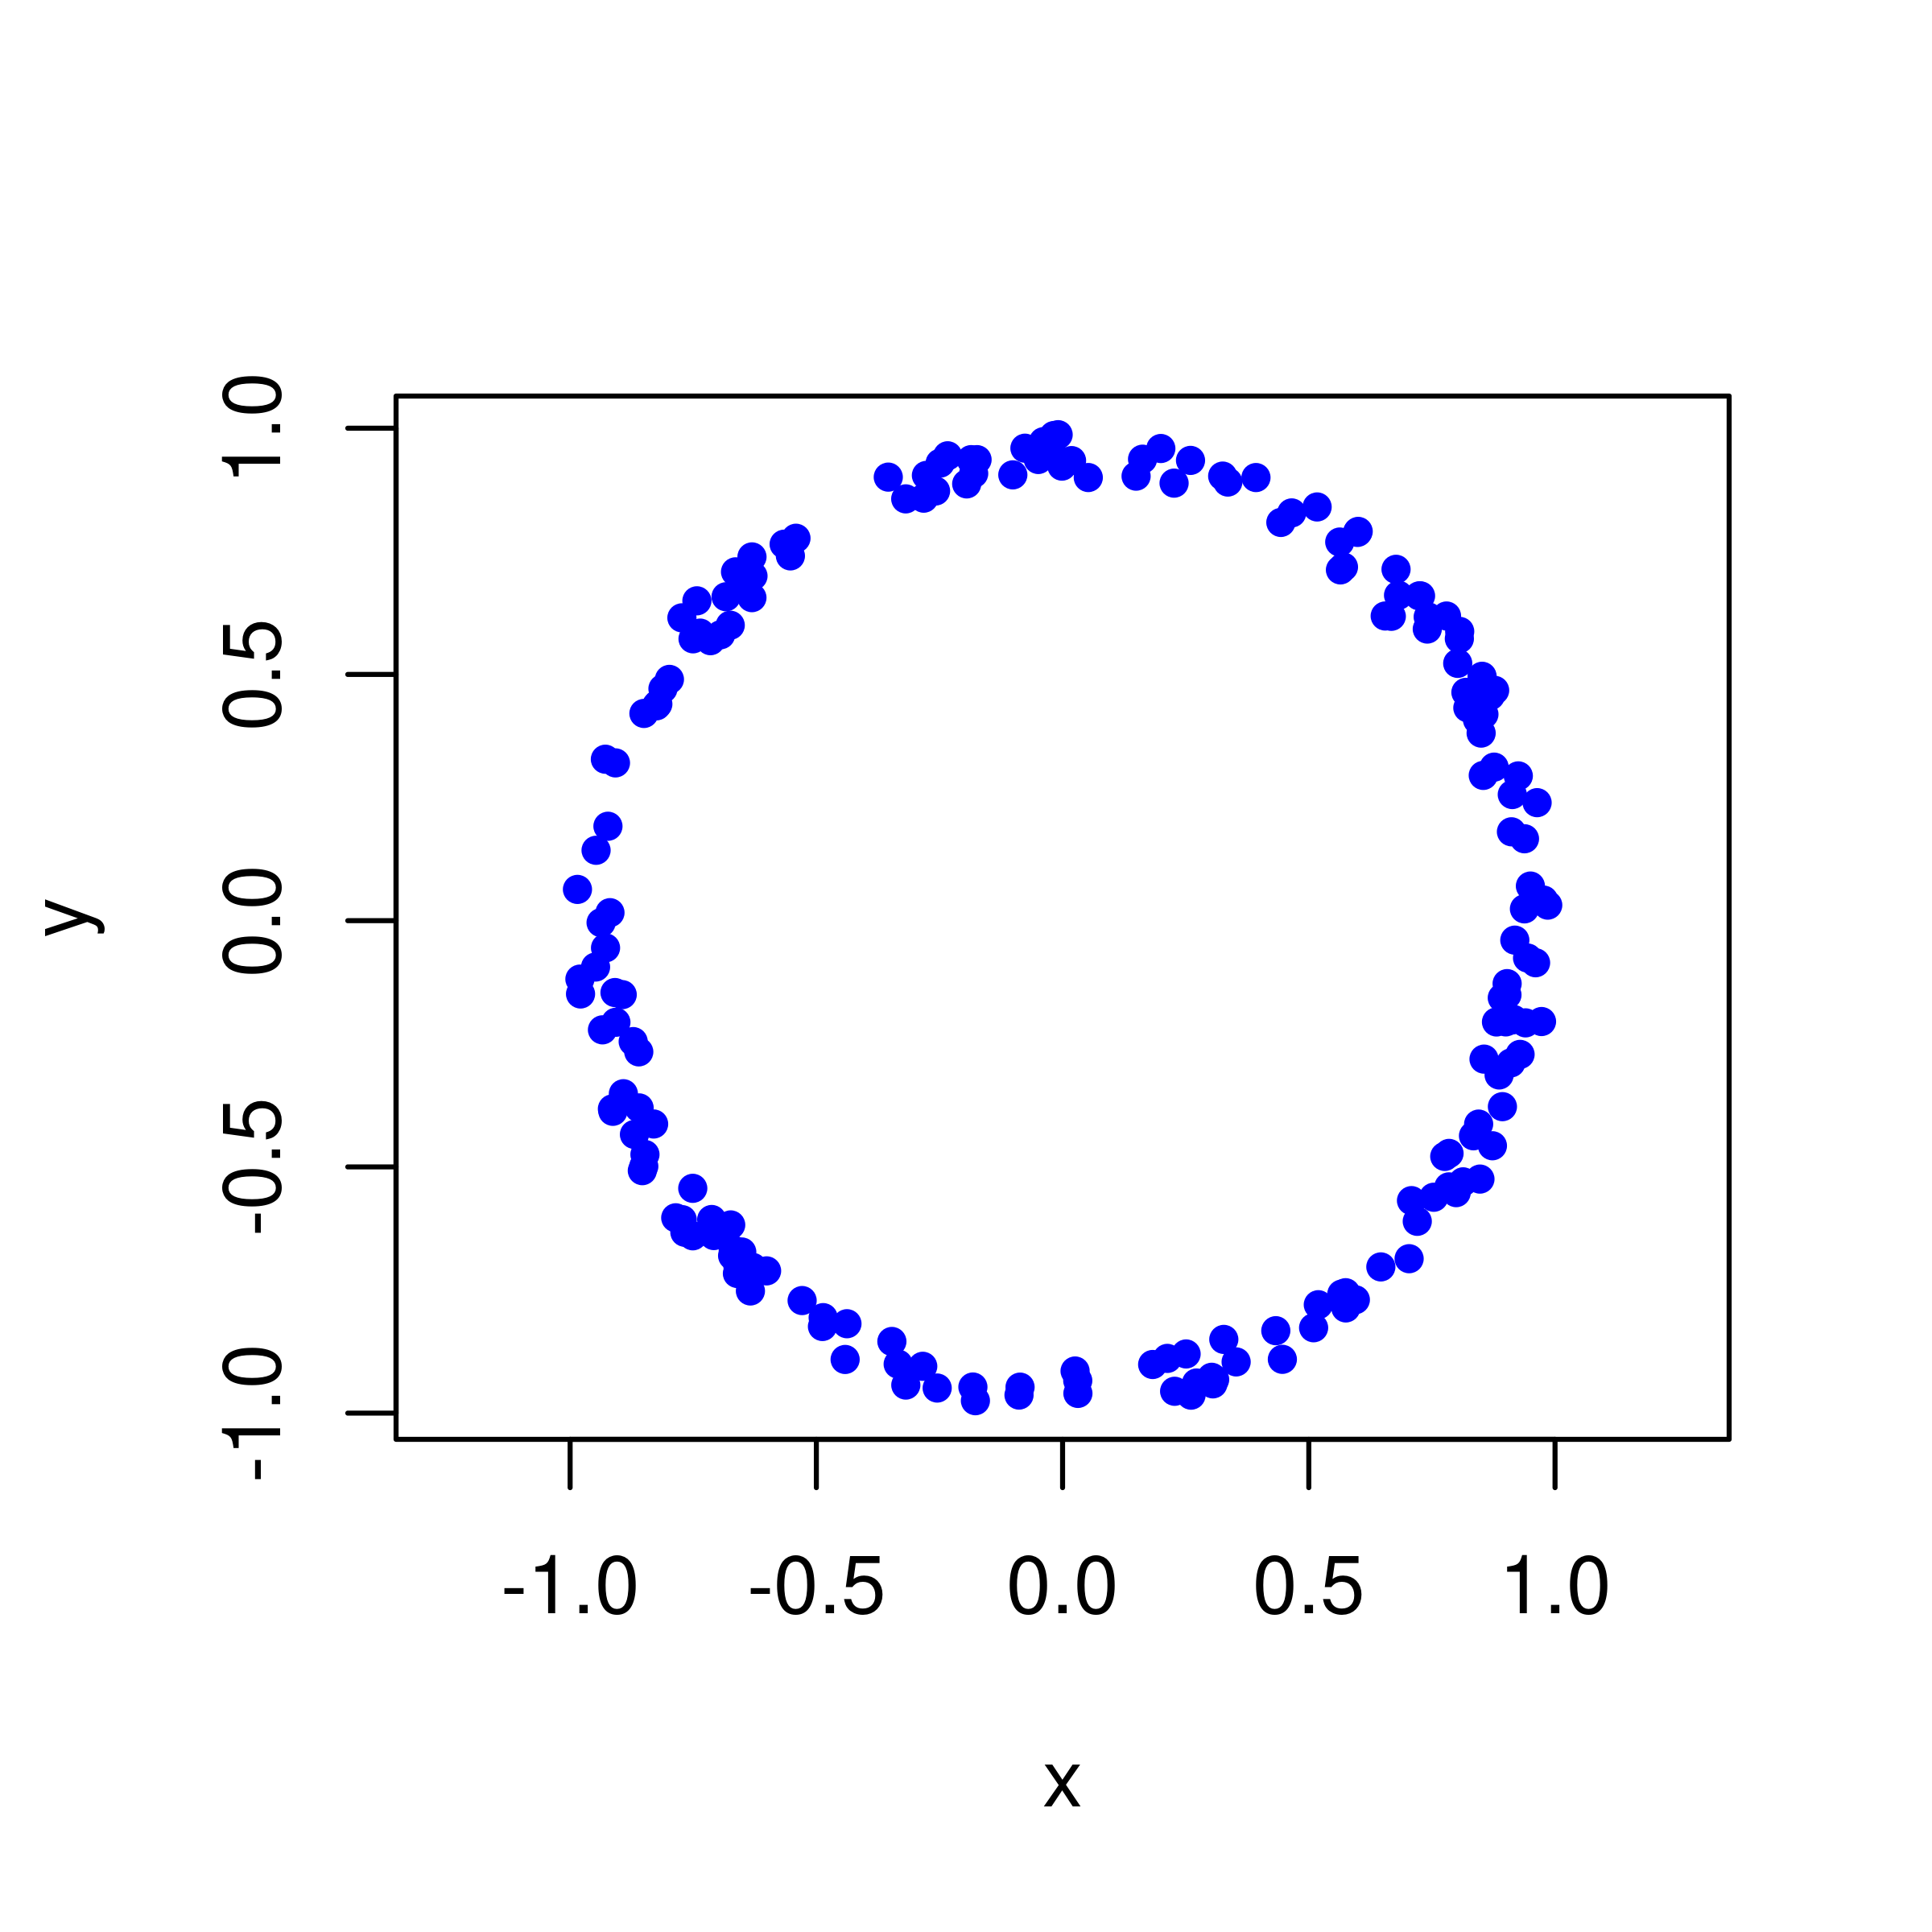
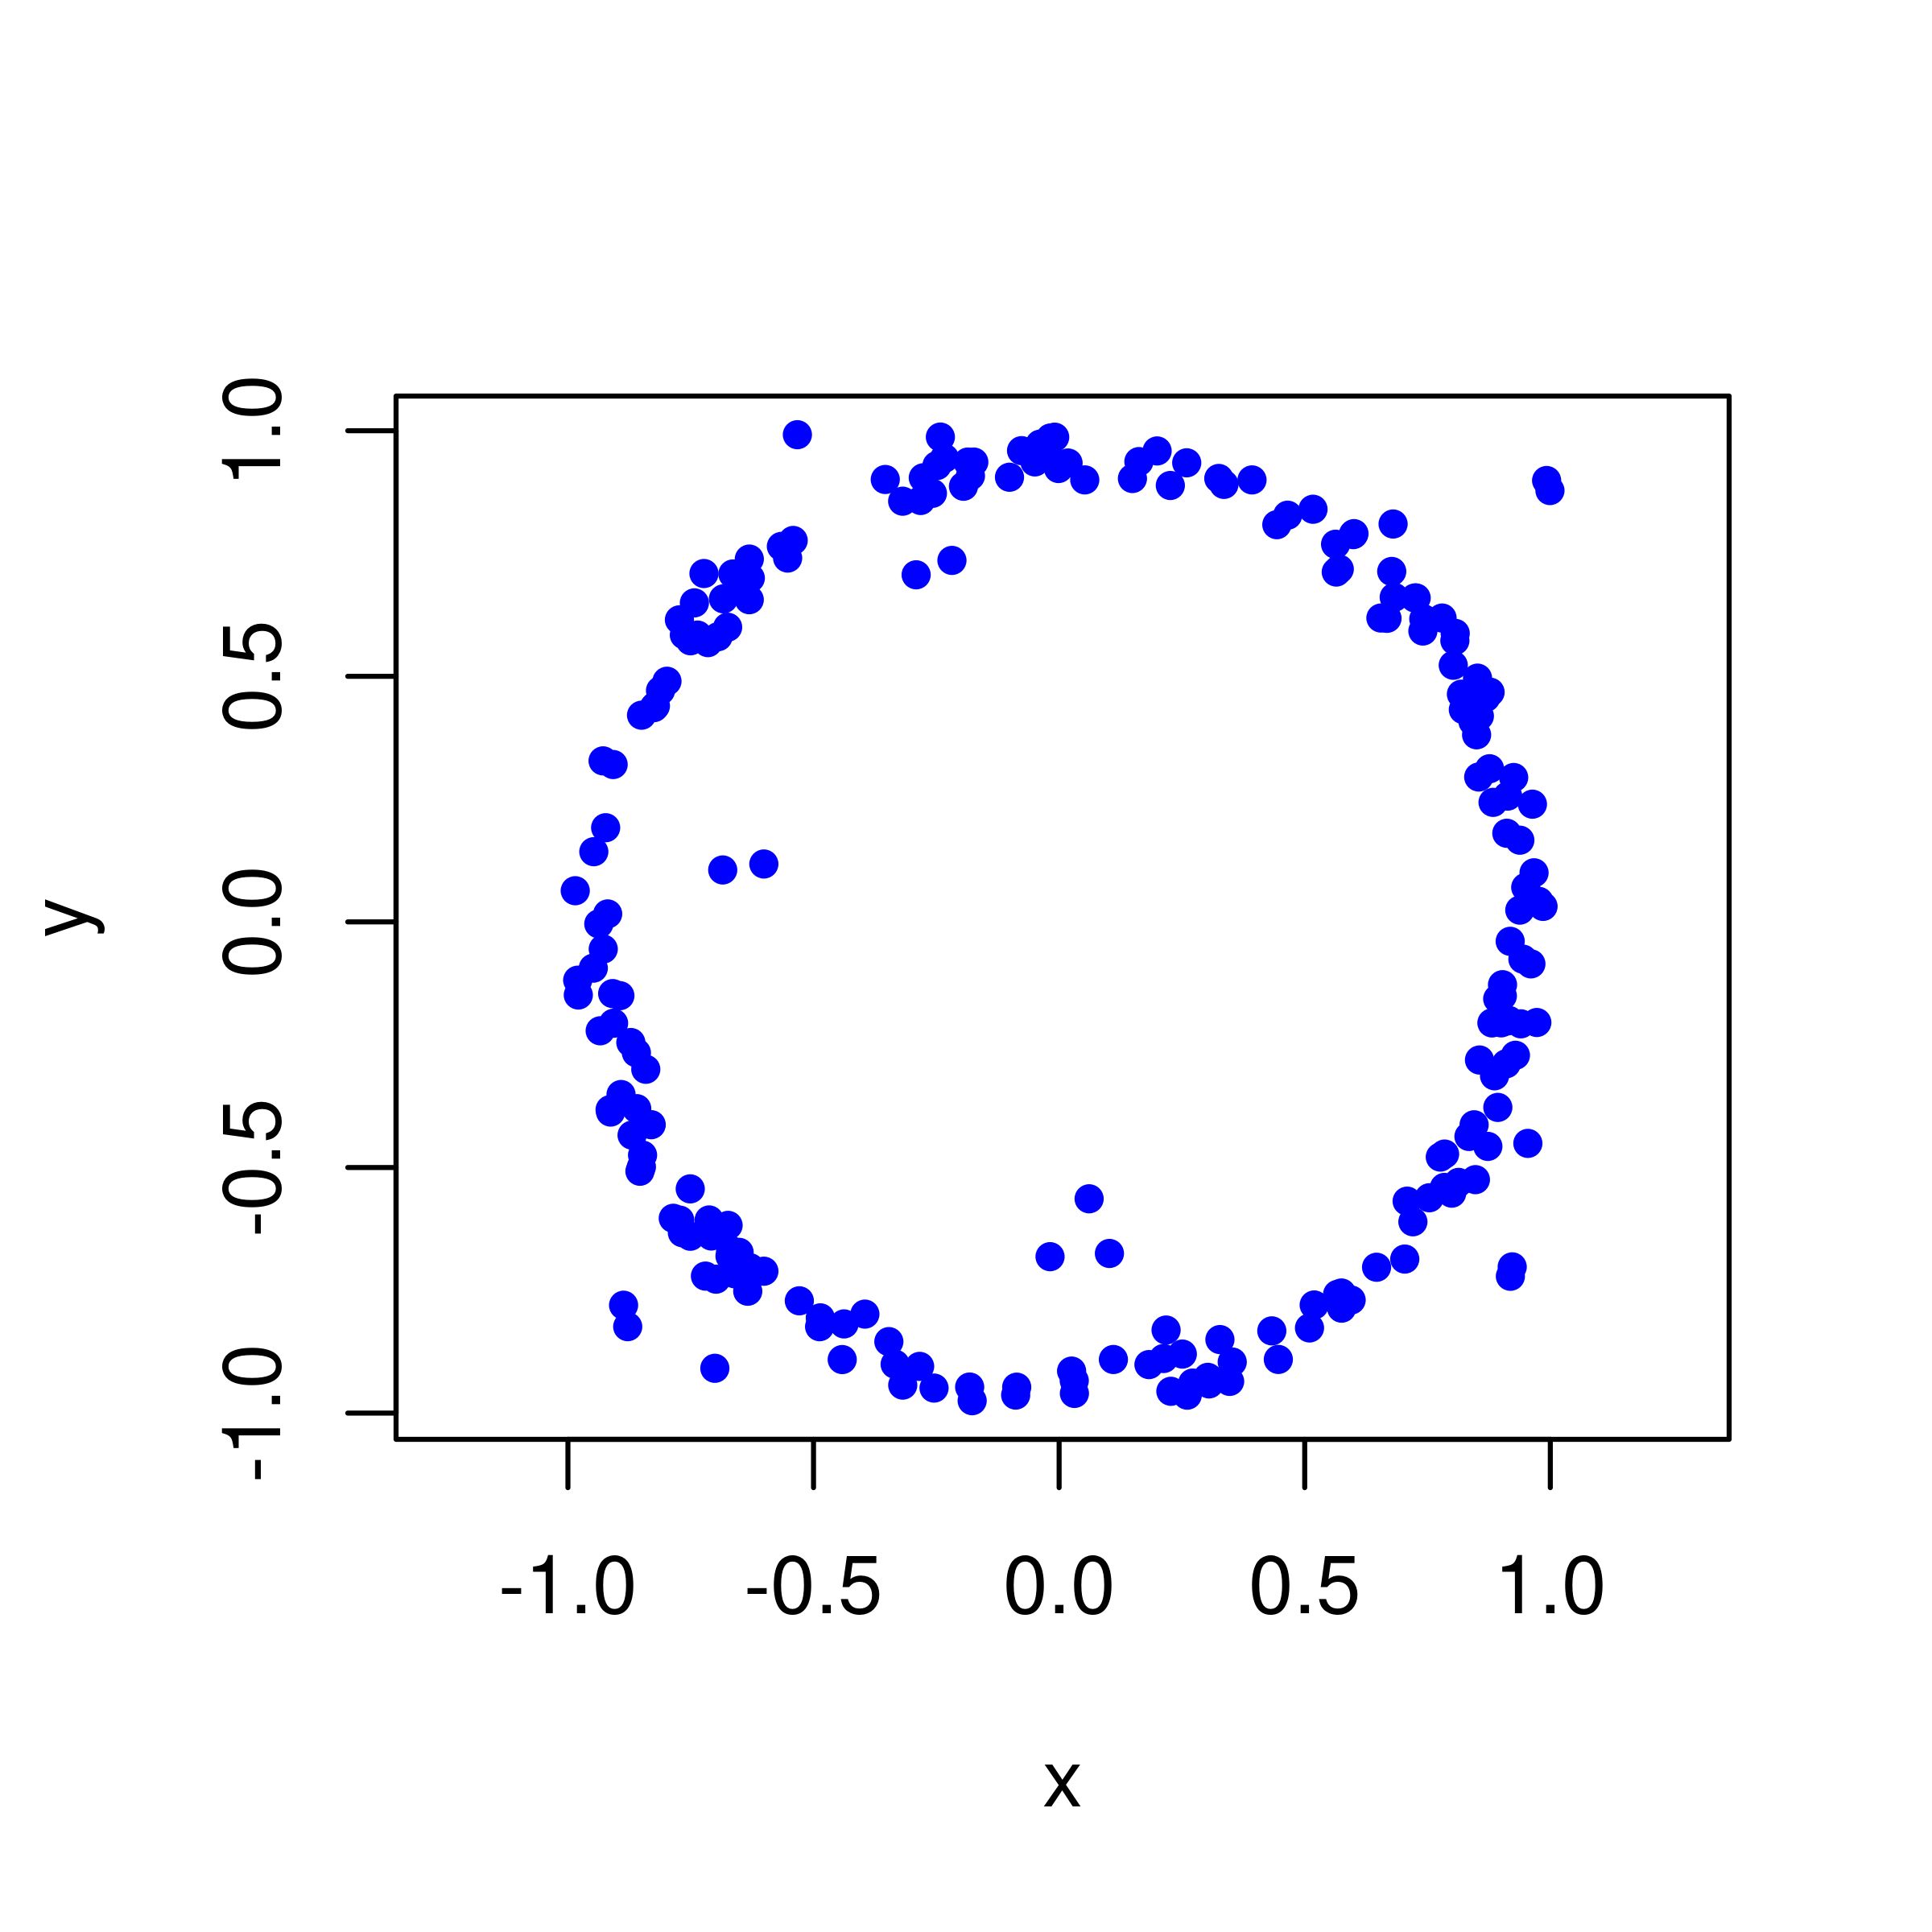
Now let’s add some uniformly distributed noise:
Z.noise <- rbind( Z, {
x <- runif(40, -1, 1)
y <- runif(40, -1, 1)
cbind(x, y)
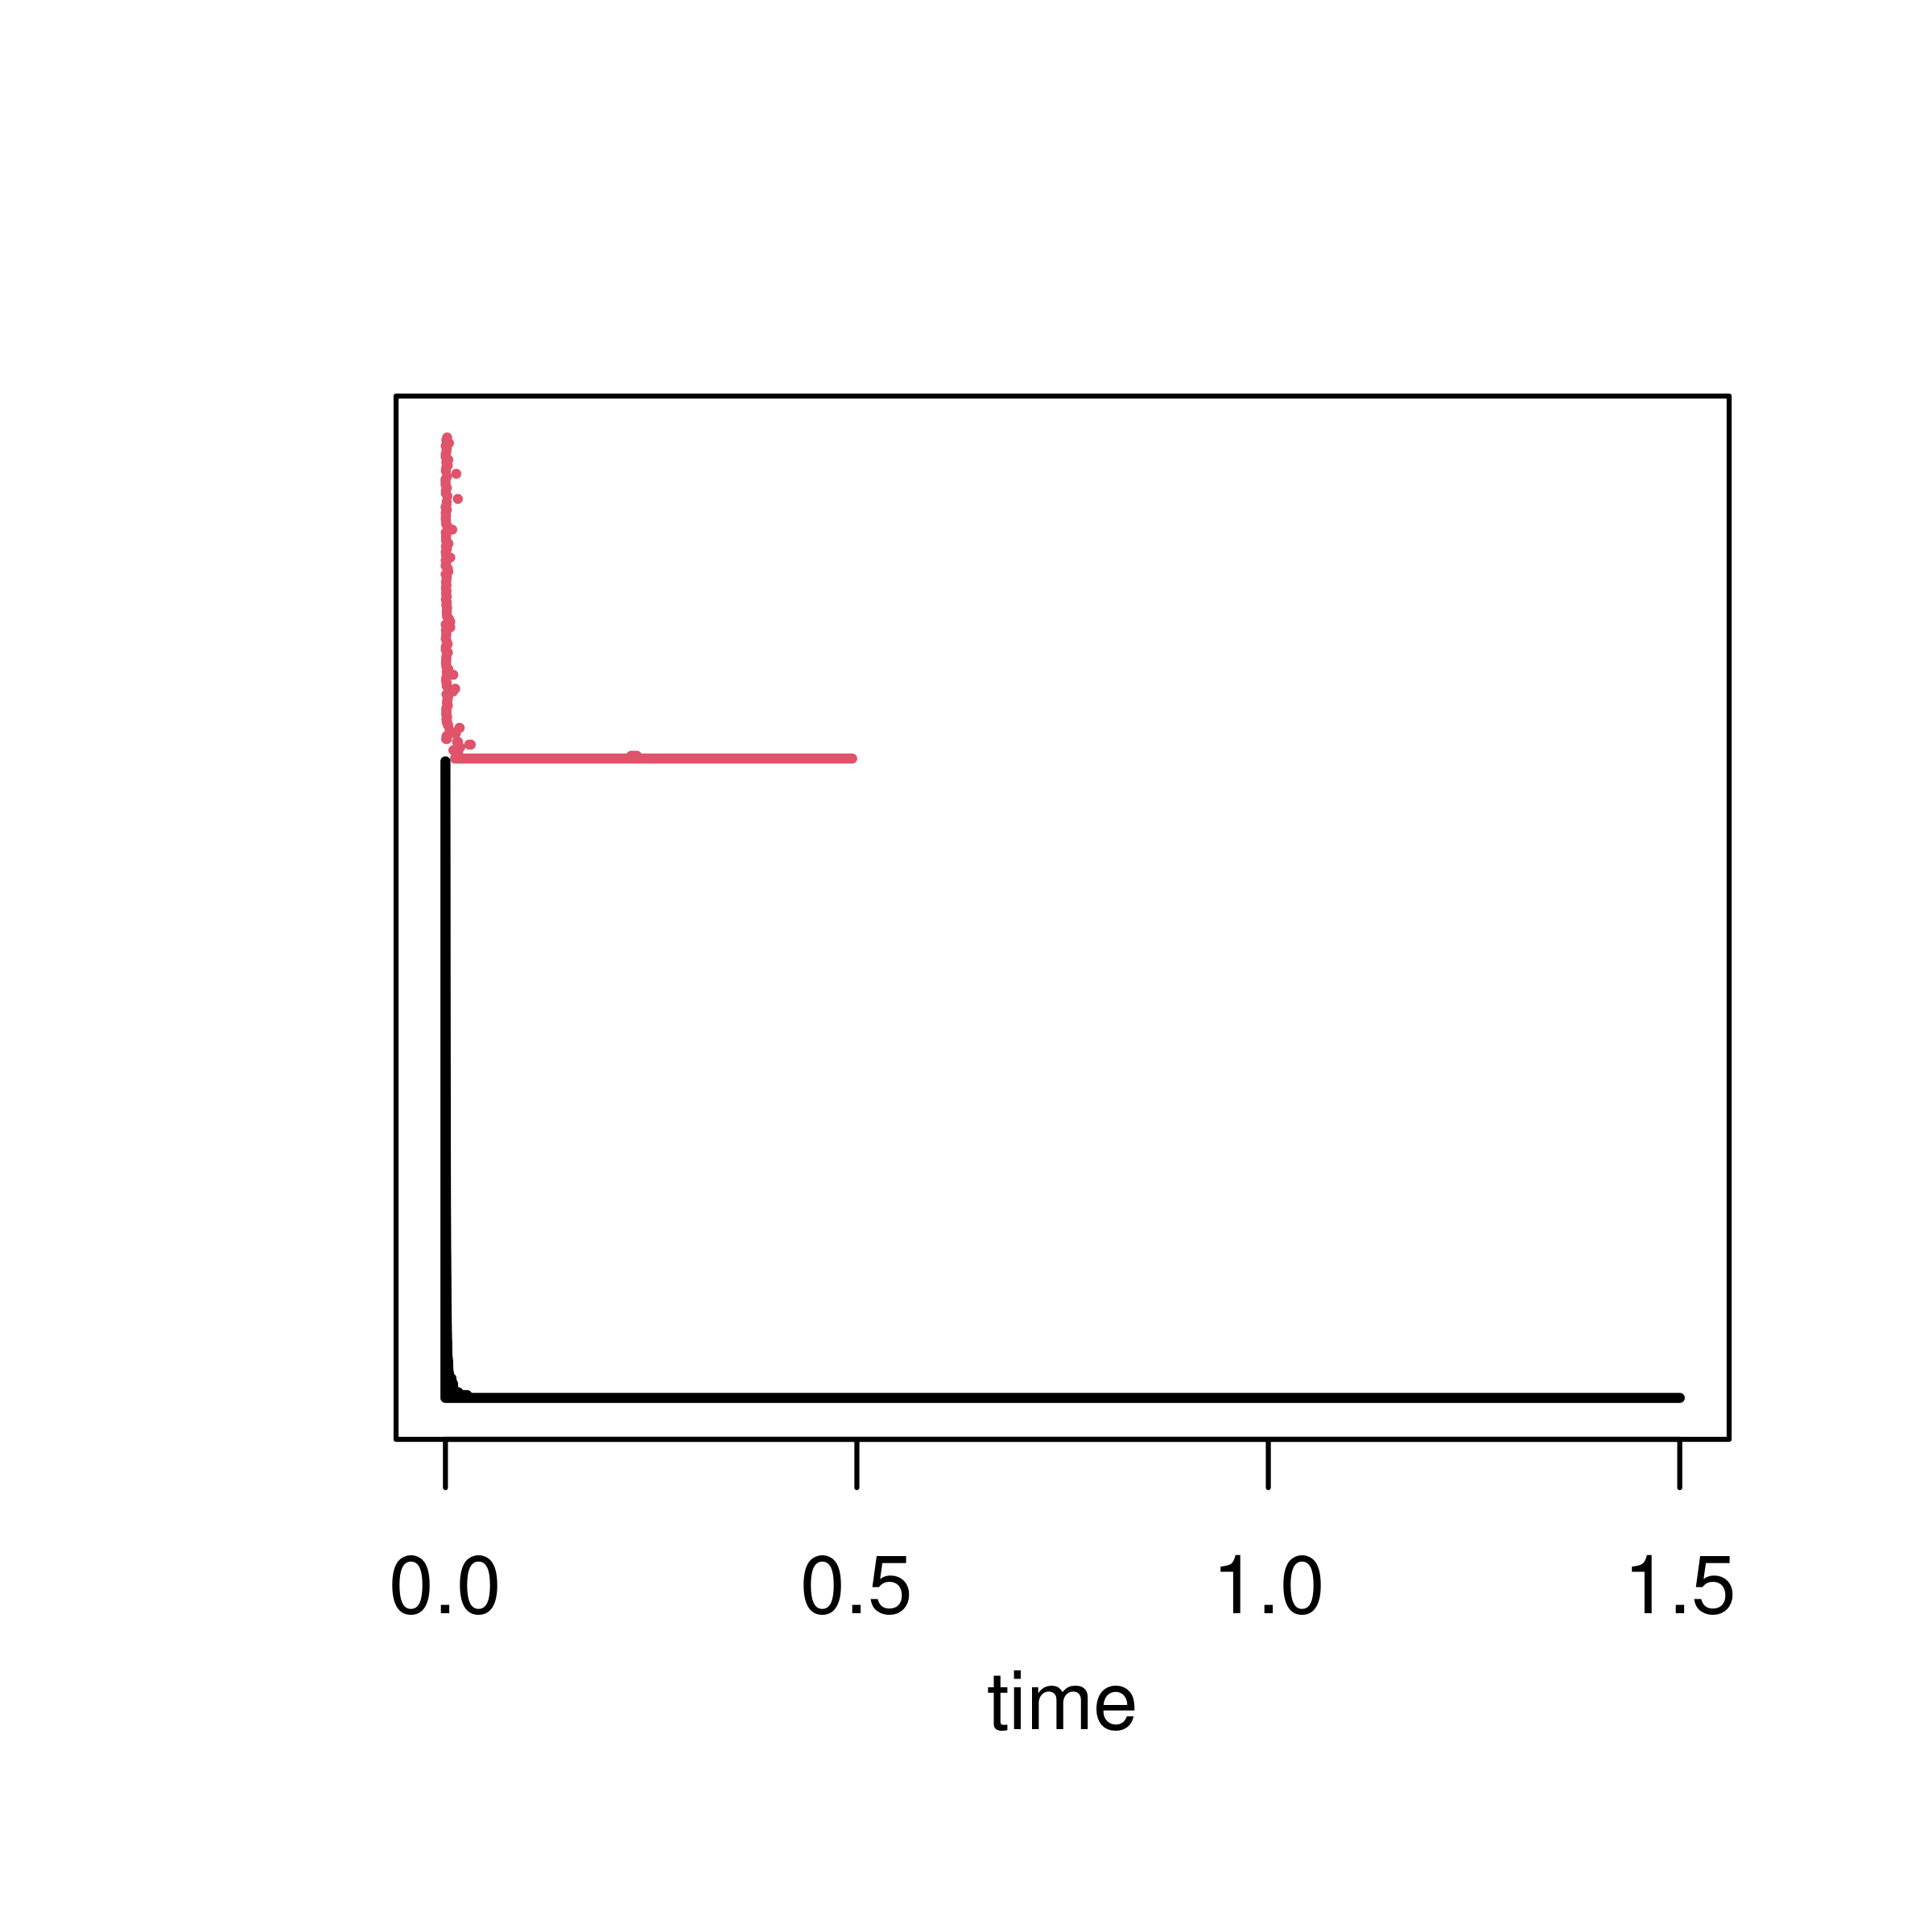
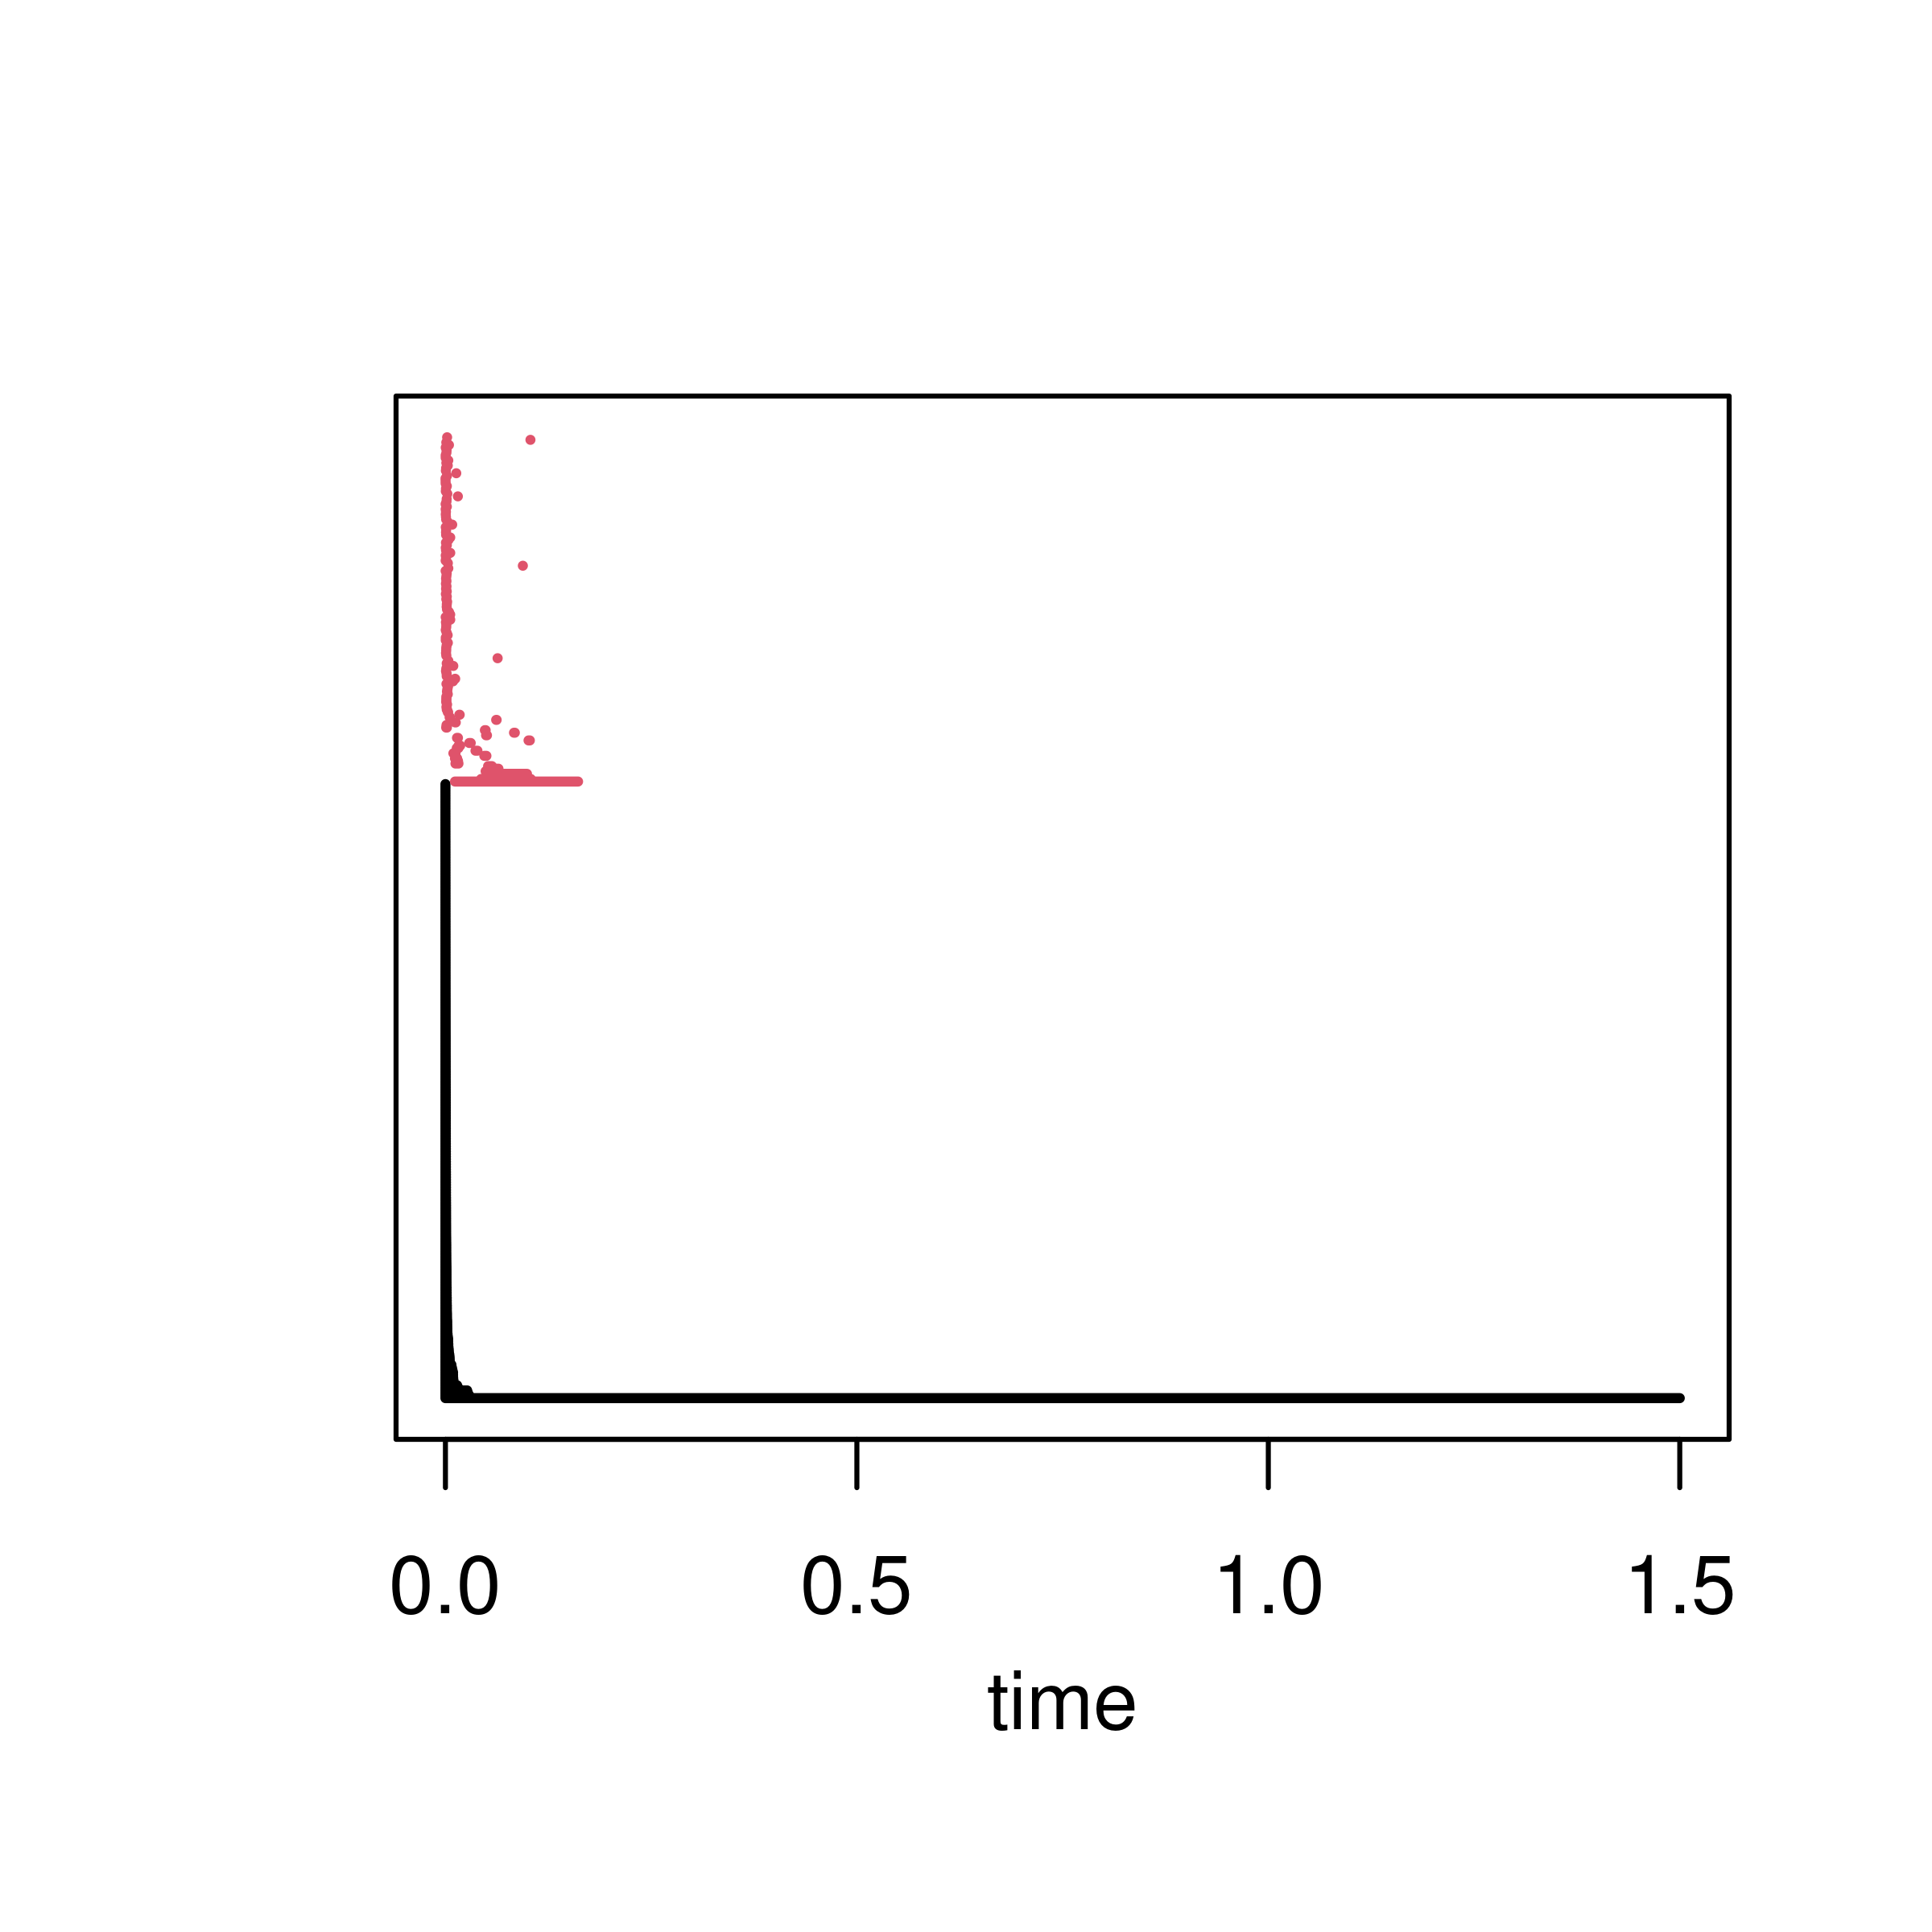
} )Plot the noisy data and the barcode:
plot(Z.noise, pch=20, col="blue", asp=1)
PH.output <- alphaComplexDiag(Z.noise)
PD <- PH.output[["diagram"]]
plot(PD, diagLim = c(0,1.5), barcode=TRUE)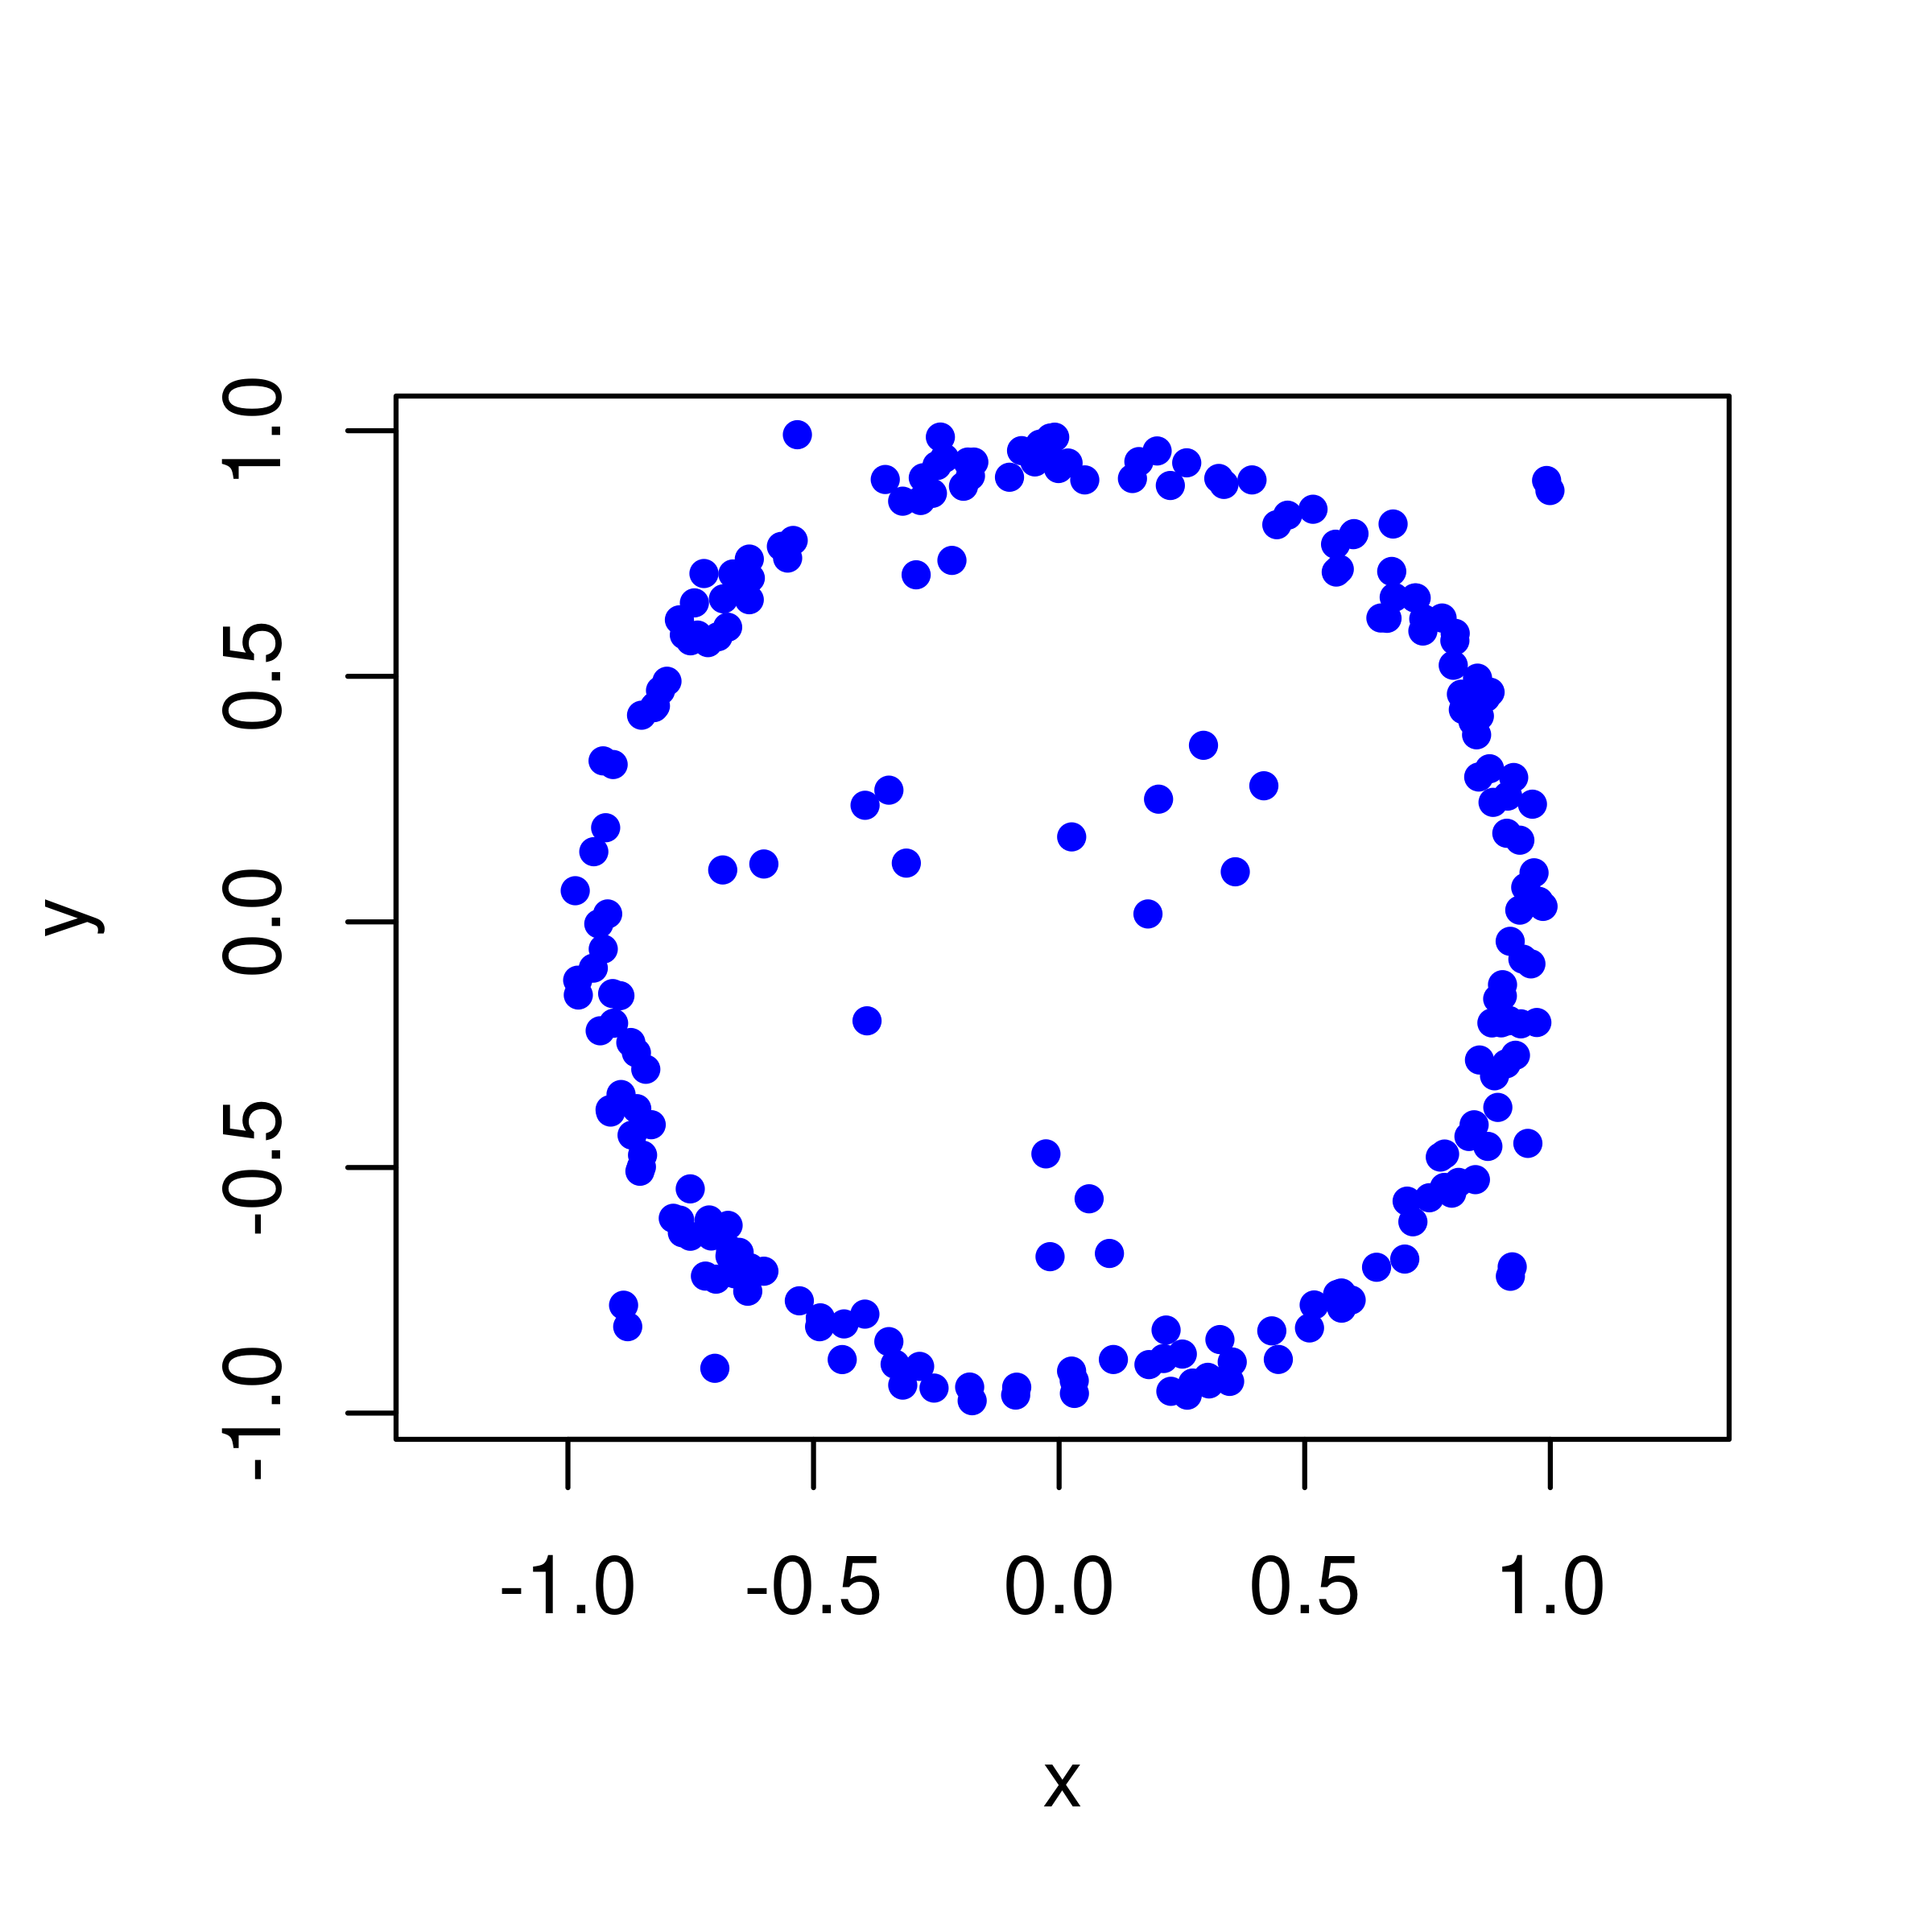
Now use knn to try and clean up the data.
library("FNN")
k <- 10
Threshold <- 0.4
dist.to.knn <- knn.dist(Z.noise)[,k]
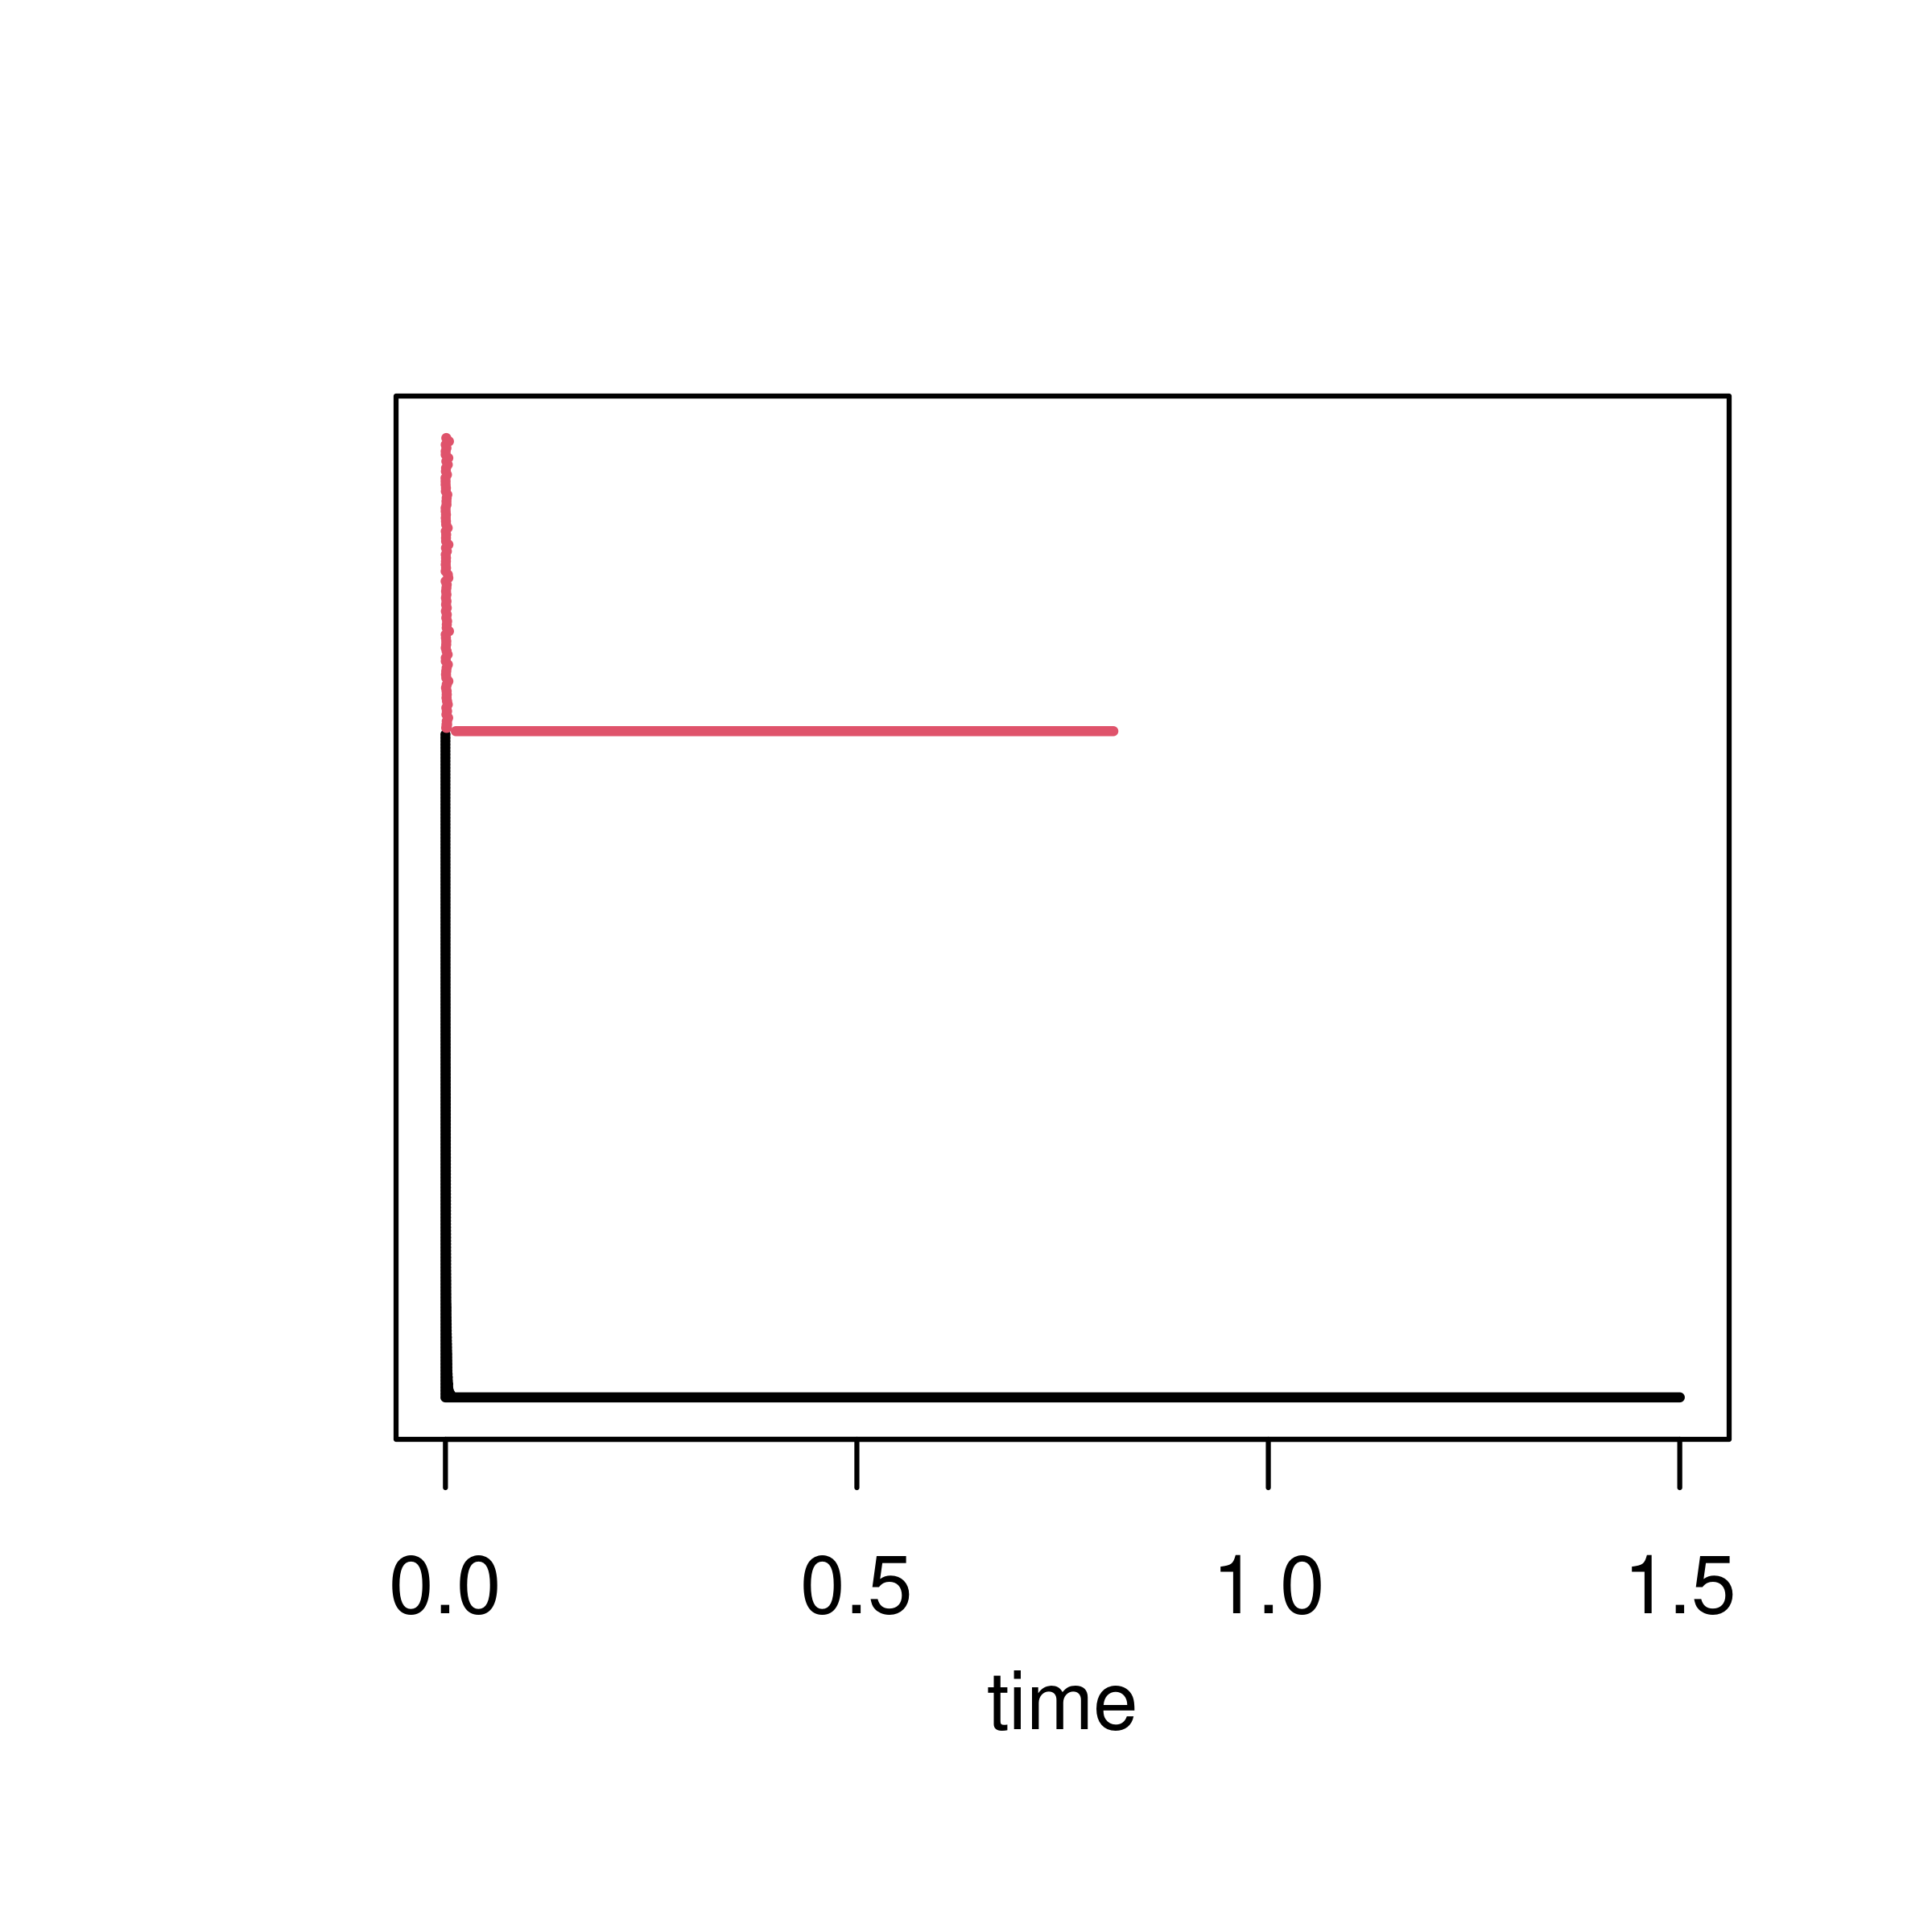
Z.cleaned <- Z.noise[dist.to.knn < Threshold,]Here’s the cleaned data and barcode:
plot(Z.cleaned, pch=20, col="blue", asp=1)
PH.output <- alphaComplexDiag(Z.cleaned)
PD <- PH.output[["diagram"]]
plot(PD, diagLim = c(0,1.5), barcode=TRUE)